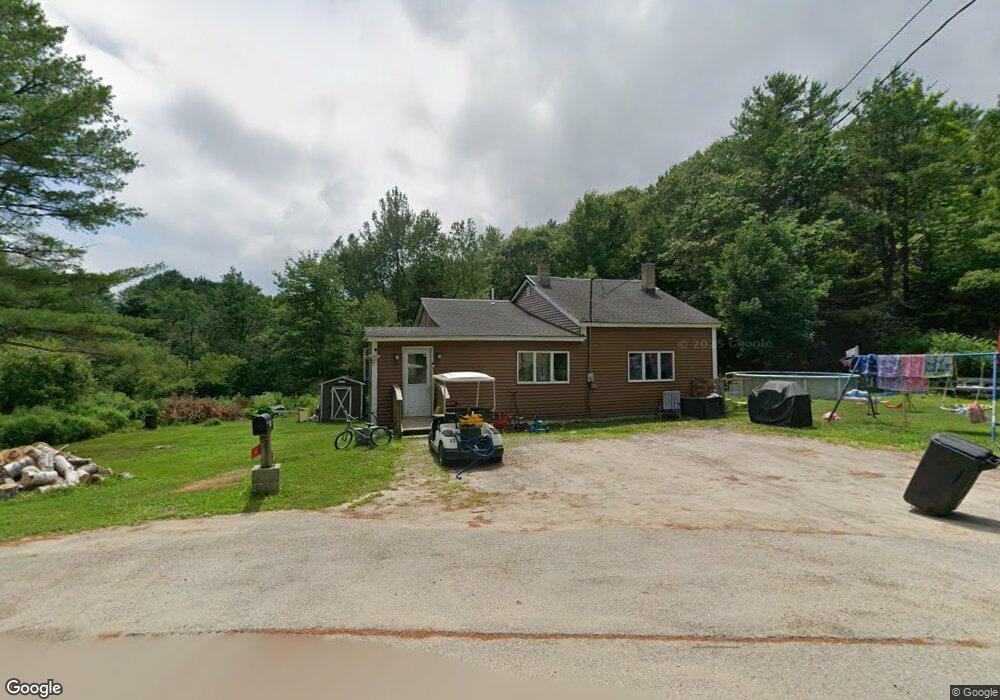
55 Sulya Rd Chelsea, ME 04330
Estimated Value: $235,509 - $329,000
--
Bed
--
Bath
1,364
Sq Ft
$207/Sq Ft
Est. Value
About This Home
This home is located at 55 Sulya Rd, Chelsea, ME 04330 and is currently estimated at $282,503, approximately $207 per square foot. 55 Sulya Rd is a home with nearby schools including Chelsea Elementary School, Maine Virtual Academy, and Stepping Stones Montessori School.
Ownership History
Date
Name
Owned For
Owner Type
Purchase Details
Closed on
Dec 31, 2018
Sold by
Cooper Wade B and Gagnon Rebecca D
Bought by
Cooper Wade B
Current Estimated Value
Home Financials for this Owner
Home Financials are based on the most recent Mortgage that was taken out on this home.
Original Mortgage
$96,000
Outstanding Balance
$84,743
Interest Rate
4.8%
Mortgage Type
New Conventional
Estimated Equity
$197,760
Purchase Details
Closed on
Jan 27, 2017
Sold by
Sirois Diane M
Bought by
Cooper Wade B and Gagnon Rebecca D
Home Financials for this Owner
Home Financials are based on the most recent Mortgage that was taken out on this home.
Original Mortgage
$76,767
Interest Rate
4.16%
Mortgage Type
Commercial
Purchase Details
Closed on
Nov 4, 2011
Sold by
Sirois Joan T and Sirois Romeo A
Bought by
Sirois Diane M
Home Financials for this Owner
Home Financials are based on the most recent Mortgage that was taken out on this home.
Original Mortgage
$42,000
Interest Rate
4.08%
Mortgage Type
Commercial
Create a Home Valuation Report for This Property
The Home Valuation Report is an in-depth analysis detailing your home's value as well as a comparison with similar homes in the area
Home Values in the Area
Average Home Value in this Area
Purchase History
| Date | Buyer | Sale Price | Title Company |
|---|---|---|---|
| Cooper Wade B | -- | -- | |
| Cooper Wade B | -- | -- | |
| Sirois Diane M | -- | -- |
Source: Public Records
Mortgage History
| Date | Status | Borrower | Loan Amount |
|---|---|---|---|
| Open | Cooper Wade B | $96,000 | |
| Previous Owner | Cooper Wade B | $76,767 | |
| Previous Owner | Sirois Diane M | $42,000 |
Source: Public Records
Tax History Compared to Growth
Tax History
| Year | Tax Paid | Tax Assessment Tax Assessment Total Assessment is a certain percentage of the fair market value that is determined by local assessors to be the total taxable value of land and additions on the property. | Land | Improvement |
|---|---|---|---|---|
| 2024 | $1,900 | $125,024 | $50,550 | $74,474 |
| 2023 | $1,776 | $100,019 | $40,440 | $59,579 |
| 2022 | $1,687 | $100,019 | $40,440 | $59,579 |
| 2021 | $1,621 | $83,349 | $33,700 | $49,649 |
| 2019 | $1,621 | $83,349 | $33,700 | $49,649 |
| 2018 | $1,663 | $83,349 | $33,700 | $49,649 |
| 2017 | $1,632 | $83,349 | $33,700 | $49,649 |
| 2016 | $1,509 | $83,349 | $33,700 | $49,649 |
| 2015 | $1,500 | $83,349 | $33,700 | $49,649 |
| 2014 | $1,434 | $83,349 | $33,700 | $49,649 |
| 2013 | $1,499 | $83,349 | $33,700 | $49,649 |
Source: Public Records
Map
Nearby Homes