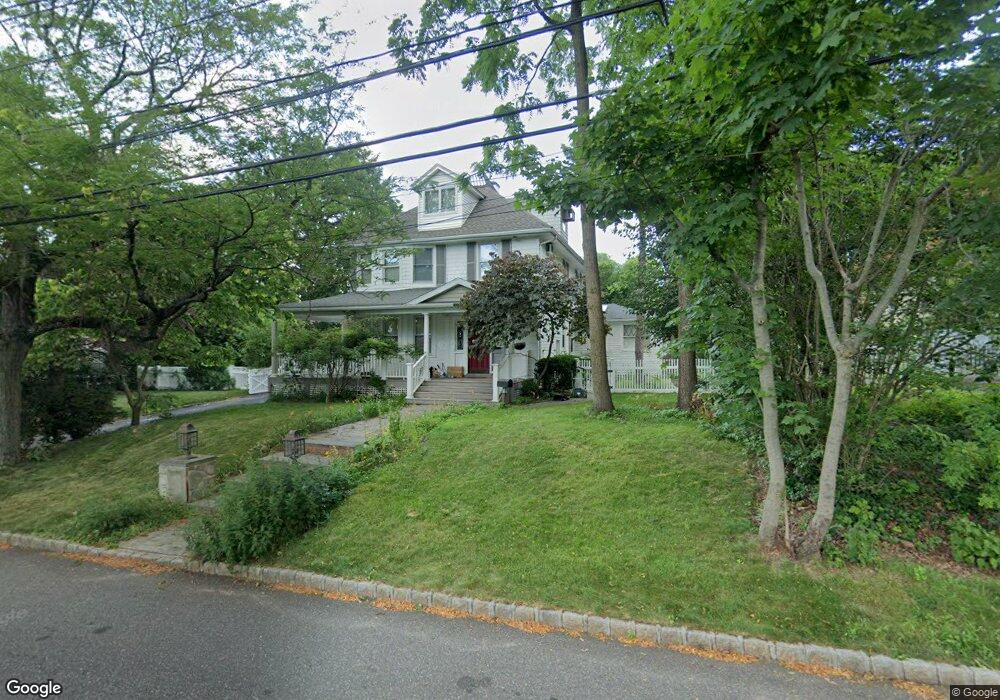
55 Susquehanna Ave Great Neck, NY 11021
Estimated Value: $1,710,236 - $1,746,000
4
Beds
5
Baths
2,326
Sq Ft
$743/Sq Ft
Est. Value
About This Home
This home is located at 55 Susquehanna Ave, Great Neck, NY 11021 and is currently estimated at $1,728,118, approximately $742 per square foot. 55 Susquehanna Ave is a home located in Nassau County with nearby schools including Saddle Rock School, Great Neck South Middle School, and Richard S. Sherman - Great Neck North Middle School.
Ownership History
Date
Name
Owned For
Owner Type
Purchase Details
Closed on
May 30, 2017
Sold by
Blaho Victoria and Coady Tristan
Bought by
Yan Yingyu and Cheng Hang
Current Estimated Value
Home Financials for this Owner
Home Financials are based on the most recent Mortgage that was taken out on this home.
Original Mortgage
$784,000
Outstanding Balance
$652,125
Interest Rate
4.02%
Mortgage Type
Adjustable Rate Mortgage/ARM
Estimated Equity
$1,075,993
Purchase Details
Closed on
Aug 14, 2009
Sold by
Davidson Sara Tony
Bought by
Coady Tristan and Blaho Vitoria
Purchase Details
Closed on
May 21, 2003
Sold by
Mor Shlomo
Bought by
Davidson Sara
Purchase Details
Closed on
Jan 19, 1999
Sold by
Don Klarrich
Bought by
Mor Shlomo and Mor M
Create a Home Valuation Report for This Property
The Home Valuation Report is an in-depth analysis detailing your home's value as well as a comparison with similar homes in the area
Home Values in the Area
Average Home Value in this Area
Purchase History
| Date | Buyer | Sale Price | Title Company |
|---|---|---|---|
| Yan Yingyu | $1,120,000 | First Manhattan Abstract | |
| Coady Tristan | $900,000 | -- | |
| Davidson Sara | $875,000 | -- | |
| Mor Shlomo | $410,000 | -- |
Source: Public Records
Mortgage History
| Date | Status | Borrower | Loan Amount |
|---|---|---|---|
| Open | Yan Yingyu | $784,000 |
Source: Public Records
Tax History Compared to Growth
Tax History
| Year | Tax Paid | Tax Assessment Tax Assessment Total Assessment is a certain percentage of the fair market value that is determined by local assessors to be the total taxable value of land and additions on the property. | Land | Improvement |
|---|---|---|---|---|
| 2025 | $21,025 | $1,080 | $565 | $515 |
| 2024 | $5,970 | $1,064 | $557 | $507 |
| 2023 | $18,041 | $1,125 | $589 | $536 |
| 2022 | $18,041 | $1,227 | $642 | $585 |
| 2021 | $18,991 | $1,177 | $548 | $629 |
| 2020 | $16,806 | $1,680 | $1,070 | $610 |
| 2019 | $19,000 | $2,130 | $1,357 | $773 |
| 2018 | $22,679 | $2,130 | $0 | $0 |
| 2017 | $13,743 | $2,130 | $1,357 | $773 |
| 2016 | $20,635 | $2,130 | $1,357 | $773 |
| 2015 | $6,678 | $2,130 | $1,357 | $773 |
| 2014 | $6,678 | $2,130 | $1,357 | $773 |
| 2013 | $6,261 | $2,130 | $1,357 | $773 |
Source: Public Records
Map
Nearby Homes
- 185 S Middle Neck Rd Unit 1G
- 195 S Middle Neck Rd Unit 2-L
- 180 S Middle Neck Rd Unit 2-A
- 12 Longview Place
- 90 Schenck Ave Unit 2L
- 200 S Middle Neck Rd Unit J-6
- 45 Hill Park Ave Unit Pr2
- 45 Hill Park Ave Unit 2L
- 50 Hill Park Ave Unit 2F
- 20 Hill Park Ave Unit 1G
- 15 Hill Park Ave Unit 1C
- 15 Hill Park Ave Unit 2-C
- 15 Hill Park Ave Unit 2O
- 40 Schenck Ave Unit 1L
- 92 Manor Dr
- 8 Welwyn Rd Unit 3F
- 88 Manor Dr
- 75 S Middle Neck Rd Unit 4H
- 100 S Middle Neck Rd Unit 102
- 37 Brompton Rd Unit 5D
- 61 Susquehanna Ave
- 21 Susquehanna Ave
- 166 Overlook Ave
- 158 Overlook Ave
- 69 Susquehanna Ave
- 150 Overlook Ave
- 176 Overlook Ave
- 48 Susquehanna Ave
- 60 Susquehanna Ave
- 50 Susquehanna Ave
- 46 Susquehanna Ave
- 71 Susquehanna Ave
- 62 Susquehanna Ave
- 19 Susquehanna Ave
- 144 Overlook Ave
- 44 Susquehanna Ave
- 178 Overlook Ave
- 73 Susquehanna Ave
- 73 Susquehanna Ave Unit whole
- 74 Susquehanna Ave