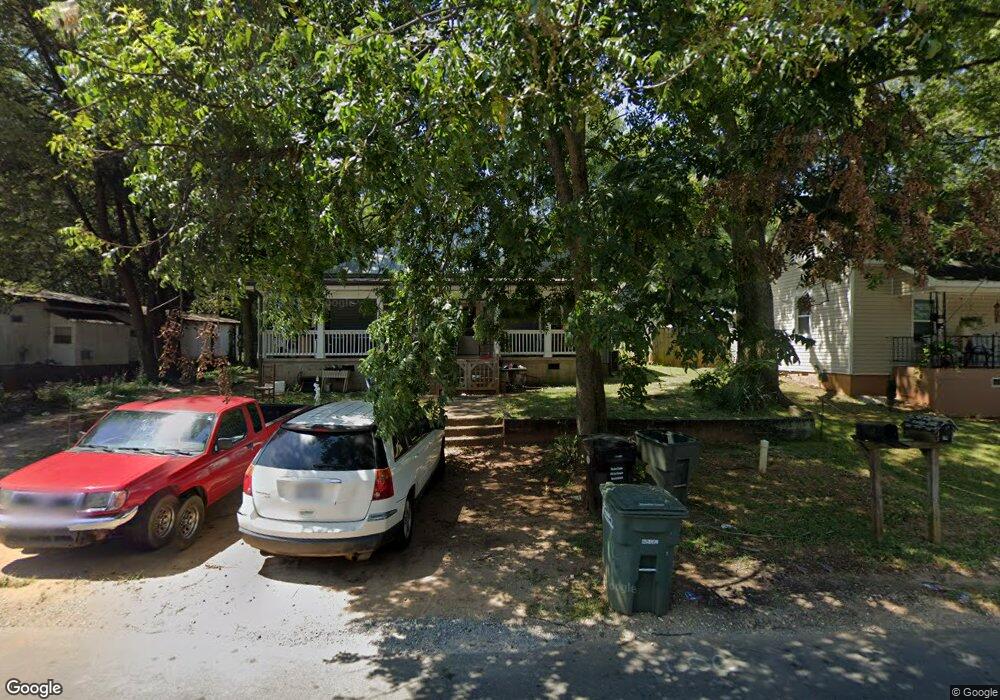
55 Swink St SW Concord, NC 28027
Estimated Value: $138,000 - $277,000
2
Beds
1
Bath
1,490
Sq Ft
$145/Sq Ft
Est. Value
About This Home
This home is located at 55 Swink St SW, Concord, NC 28027 and is currently estimated at $216,650, approximately $145 per square foot. 55 Swink St SW is a home located in Cabarrus County with nearby schools including Wolf Meadow Elementary School, Roberta Road Middle School, and The Daniel Academy of Concord.
Ownership History
Date
Name
Owned For
Owner Type
Purchase Details
Closed on
Jun 15, 2017
Sold by
Orozco Filiverto Zuniga
Bought by
Martinez Jose Ignacio Zuniga
Current Estimated Value
Purchase Details
Closed on
Jun 18, 2012
Sold by
Federal National Mortgage Association
Bought by
Orosco Filiberto Zuniga
Purchase Details
Closed on
Mar 5, 2012
Sold by
Seaford Robbie J
Bought by
Federal National Mortgage Association
Purchase Details
Closed on
Aug 18, 2000
Sold by
Freeze Doris S and Freeze John
Bought by
Seaford Robbie Jean
Home Financials for this Owner
Home Financials are based on the most recent Mortgage that was taken out on this home.
Original Mortgage
$46,500
Interest Rate
7.9%
Purchase Details
Closed on
Jan 1, 1989
Bought by
Freeze Doris S
Create a Home Valuation Report for This Property
The Home Valuation Report is an in-depth analysis detailing your home's value as well as a comparison with similar homes in the area
Home Values in the Area
Average Home Value in this Area
Purchase History
| Date | Buyer | Sale Price | Title Company |
|---|---|---|---|
| Martinez Jose Ignacio Zuniga | -- | None Available | |
| Orosco Filiberto Zuniga | -- | None Available | |
| Federal National Mortgage Association | $71,154 | None Available | |
| Seaford Robbie Jean | $46,500 | -- | |
| Freeze Doris S | $15,000 | -- |
Source: Public Records
Mortgage History
| Date | Status | Borrower | Loan Amount |
|---|---|---|---|
| Previous Owner | Seaford Robbie Jean | $46,500 |
Source: Public Records
Tax History Compared to Growth
Tax History
| Year | Tax Paid | Tax Assessment Tax Assessment Total Assessment is a certain percentage of the fair market value that is determined by local assessors to be the total taxable value of land and additions on the property. | Land | Improvement |
|---|---|---|---|---|
| 2025 | $1,542 | $154,850 | $48,000 | $106,850 |
| 2024 | $1,406 | $141,130 | $48,000 | $93,130 |
| 2023 | $625 | $51,230 | $15,000 | $36,230 |
| 2022 | $625 | $51,230 | $15,000 | $36,230 |
| 2021 | $625 | $51,230 | $15,000 | $36,230 |
| 2020 | $625 | $51,230 | $15,000 | $36,230 |
| 2019 | $534 | $43,800 | $10,500 | $33,300 |
| 2018 | $526 | $43,800 | $10,500 | $33,300 |
| 2017 | $517 | $43,800 | $10,500 | $33,300 |
| 2016 | $307 | $45,630 | $12,500 | $33,130 |
| 2015 | $538 | $45,630 | $12,500 | $33,130 |
| 2014 | $538 | $45,630 | $12,500 | $33,130 |
Source: Public Records
Map
Nearby Homes
- 368 Office Dr SW
- 600 Sunderland Rd
- 64 Robinson Dr SW
- 131 Swink St SW
- 620 Palmer Ave SW
- 7 Bost Ave SW
- 12 Bost Ave SW
- 5 Bost Ave SW
- 0000 Bost Ave SW
- 142 Swink St SW
- 146 Swink St SW
- 149 Swink St SW
- 8 Meadowview Ave SW
- 0000 Meadowview Ave SW
- 64 Hawthorne St SW
- 41 Fleetwood Dr SW
- 758 Main St SW
- 207 Highland Ave SW
- 1015 Rockland Cir SW
- 782 Chalice St SW
- 51 Swink St SW
- 45 Swink St SW
- 50 Swink St SW
- 59 Swink St SW
- 46 Swink St SW
- 43 Swink St SW
- 155 Hartsell School Rd SW
- 174 Hartsell School Rd SW
- 21 Swink St SW
- 54 Swink St SW
- 58 Swink St SW
- 63 Swink St SW
- 159 Hartsell School Rd SW
- 67 Swink St SW
- 660 Old Charlotte Rd SW
- 163 Hartsell School Rd SW
- 163 Hartsell School Rd SW Unit 17
- 654 Old Charlotte Rd SW
- 156 Hartsell School Rd SW
- 160 Hartsell School Rd SW