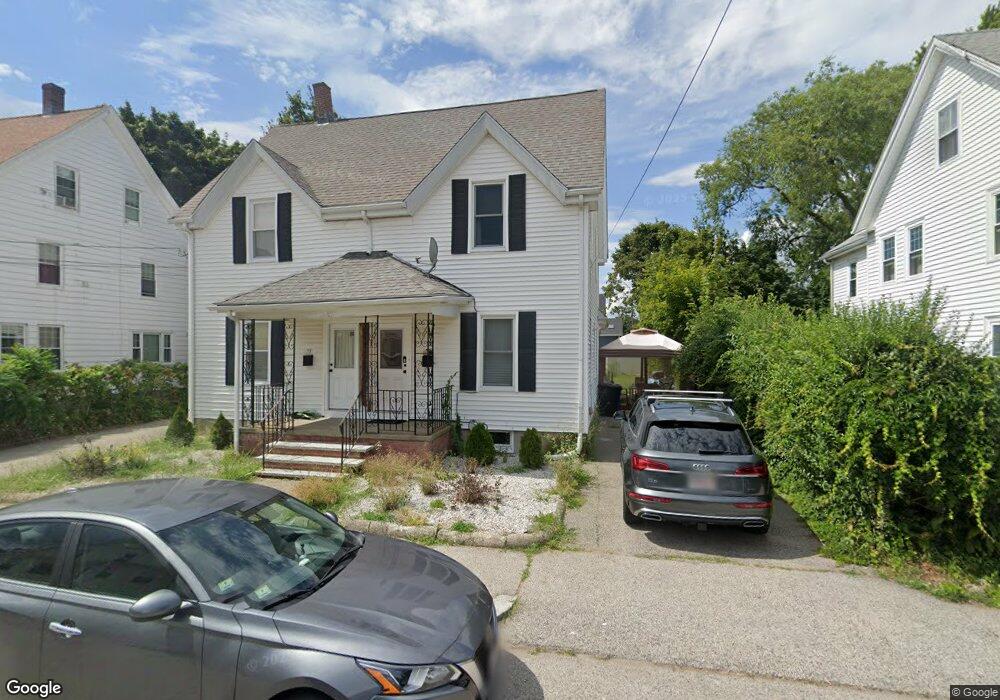
55 Trafford St Unit 1 Quincy, MA 02169
South Quincy NeighborhoodEstimated Value: $733,181 - $818,000
2
Beds
2
Baths
950
Sq Ft
$836/Sq Ft
Est. Value
About This Home
This home is located at 55 Trafford St Unit 1, Quincy, MA 02169 and is currently estimated at $793,795, approximately $835 per square foot. 55 Trafford St Unit 1 is a home located in Norfolk County with nearby schools including South West Middle School, Lincoln-Hancock Community School, and Quincy High School.
Ownership History
Date
Name
Owned For
Owner Type
Purchase Details
Closed on
Jan 26, 2021
Sold by
Odriscoll Edward
Bought by
Odriscoll Edward and Odriscoll Brid
Current Estimated Value
Purchase Details
Closed on
Aug 28, 2015
Sold by
Consoli Joseph and Consoli Josephine
Bought by
Odriscoll Edward
Home Financials for this Owner
Home Financials are based on the most recent Mortgage that was taken out on this home.
Original Mortgage
$330,000
Interest Rate
4.09%
Mortgage Type
New Conventional
Purchase Details
Closed on
Sep 13, 2012
Sold by
Consoli Guy and Consoli Josephine
Bought by
Consoli Joseph and Consoli Josephine
Purchase Details
Closed on
Jul 6, 1999
Sold by
Cellucci Renato
Bought by
Consoli Guy and Consoli Josephine
Home Financials for this Owner
Home Financials are based on the most recent Mortgage that was taken out on this home.
Original Mortgage
$165,000
Interest Rate
7.19%
Mortgage Type
Purchase Money Mortgage
Create a Home Valuation Report for This Property
The Home Valuation Report is an in-depth analysis detailing your home's value as well as a comparison with similar homes in the area
Home Values in the Area
Average Home Value in this Area
Purchase History
| Date | Buyer | Sale Price | Title Company |
|---|---|---|---|
| Odriscoll Edward | -- | None Available | |
| Odriscoll Edward | $440,000 | -- | |
| Consoli Joseph | -- | -- | |
| Consoli Joseph A | -- | -- | |
| Consoli Guy | $220,000 | -- |
Source: Public Records
Mortgage History
| Date | Status | Borrower | Loan Amount |
|---|---|---|---|
| Previous Owner | Odriscoll Edward | $330,000 | |
| Previous Owner | Consoli Guy | $165,000 |
Source: Public Records
Tax History
| Year | Tax Paid | Tax Assessment Tax Assessment Total Assessment is a certain percentage of the fair market value that is determined by local assessors to be the total taxable value of land and additions on the property. | Land | Improvement |
|---|---|---|---|---|
| 2025 | $7,581 | $657,500 | $285,000 | $372,500 |
| 2024 | $7,140 | $633,500 | $271,400 | $362,100 |
| 2023 | $6,776 | $608,800 | $246,700 | $362,100 |
| 2022 | $6,578 | $549,100 | $205,600 | $343,500 |
| 2021 | $6,252 | $515,000 | $205,600 | $309,400 |
| 2020 | $6,549 | $526,900 | $205,600 | $321,300 |
| 2019 | $5,819 | $463,700 | $194,000 | $269,700 |
| 2018 | $5,798 | $434,600 | $179,600 | $255,000 |
| 2017 | $5,974 | $421,600 | $171,100 | $250,500 |
| 2016 | $5,510 | $383,700 | $148,700 | $235,000 |
| 2015 | $5,414 | $370,800 | $148,700 | $222,100 |
| 2014 | $4,717 | $317,400 | $148,700 | $168,700 |
Source: Public Records
Map
Nearby Homes
- 21 Totman St Unit 205
- 21 Totman St Unit 403
- 21 Totman St Unit 301
- 21 Totman St Unit 204
- 56 Penn St Unit 4
- 51 Branch St Unit 3
- 8 Jackson St Unit B1
- 8 Jackson St Unit B4
- 87 Franklin St Unit 105
- 9 Independence Ave Unit 102
- 91 Garfield St
- 202 Kendrick Ave
- 11 Pearl St
- 150 Madison Ave
- 156 West St
- 39-47 Water St
- 211 West St Unit 11B
- 211 West St Unit 4B
- 211 West St Unit 12B
- 211 Copeland St
- 55 Trafford St
- 55 Trafford St Unit 55
- 61 Trafford St Unit 3
- 59 Trafford St Unit 1
- 59 Trafford St
- 51 Trafford St
- 62 Trafford St Unit 2
- 60 Trafford St Unit 1
- 48 Rodman St
- 50 Trafford St
- 45 Trafford St
- 65 Trafford St
- 52 Rodman St
- 53 Taber St
- 43 Trafford St Unit 43
- 43 Trafford St
- 64 Trafford St
- 64 Trafford St Unit 4
- 64 Trafford St Unit 5
- 64 Trafford St Unit 2
Your Personal Tour Guide
Ask me questions while you tour the home.