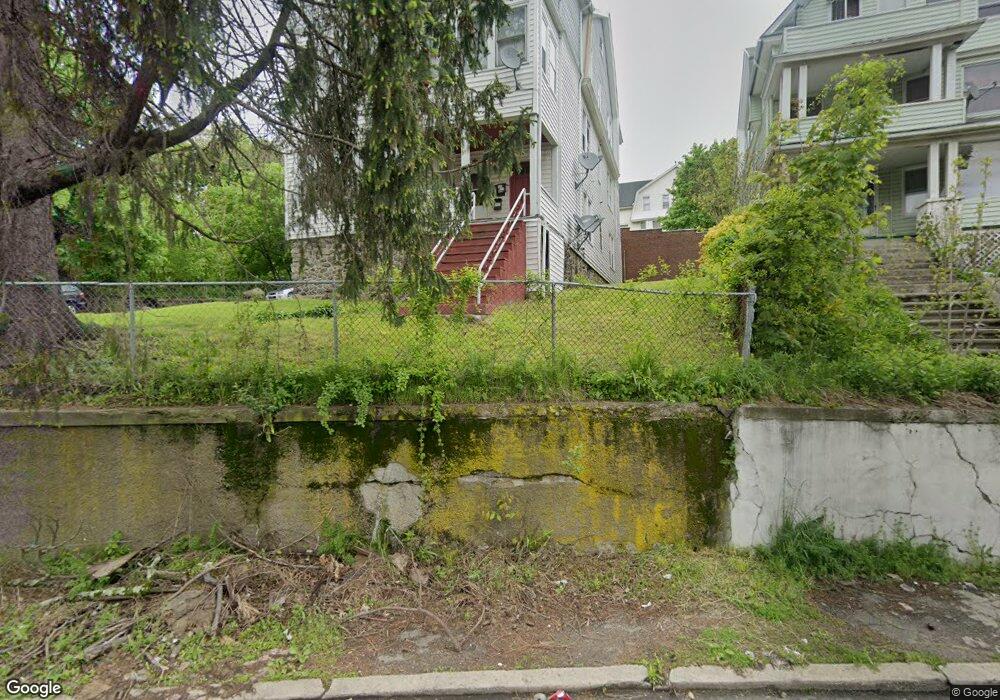
55 Walnut Ave Waterbury, CT 06704
North End District NeighborhoodEstimated Value: $315,000 - $391,000
6
Beds
3
Baths
3,594
Sq Ft
$97/Sq Ft
Est. Value
About This Home
This home is located at 55 Walnut Ave, Waterbury, CT 06704 and is currently estimated at $347,333, approximately $96 per square foot. 55 Walnut Ave is a home located in New Haven County with nearby schools including Walsh School, Michael F. Wallace Middle School, and Crosby High School.
Ownership History
Date
Name
Owned For
Owner Type
Purchase Details
Closed on
Apr 10, 2025
Sold by
Gallego Maria C
Bought by
Anguisaca Jefferson F and Gallego Maria C
Current Estimated Value
Purchase Details
Closed on
May 23, 2014
Sold by
Vargas Danny J
Bought by
German Zpila
Create a Home Valuation Report for This Property
The Home Valuation Report is an in-depth analysis detailing your home's value as well as a comparison with similar homes in the area
Home Values in the Area
Average Home Value in this Area
Purchase History
| Date | Buyer | Sale Price | Title Company |
|---|---|---|---|
| Anguisaca Jefferson F | -- | None Available | |
| Anguisaca Jefferson F | -- | None Available | |
| German Zpila | -- | -- | |
| German Zpila | -- | -- |
Source: Public Records
Mortgage History
| Date | Status | Borrower | Loan Amount |
|---|---|---|---|
| Previous Owner | German Zpila | $96,750 |
Source: Public Records
Tax History Compared to Growth
Tax History
| Year | Tax Paid | Tax Assessment Tax Assessment Total Assessment is a certain percentage of the fair market value that is determined by local assessors to be the total taxable value of land and additions on the property. | Land | Improvement |
|---|---|---|---|---|
| 2025 | $5,979 | $132,930 | $11,480 | $121,450 |
| 2024 | $6,572 | $132,930 | $11,480 | $121,450 |
| 2023 | $7,203 | $132,930 | $11,480 | $121,450 |
| 2022 | $3,586 | $59,550 | $11,490 | $48,060 |
| 2021 | $3,586 | $59,550 | $11,490 | $48,060 |
| 2020 | $3,586 | $59,550 | $11,490 | $48,060 |
| 2019 | $3,586 | $59,550 | $11,490 | $48,060 |
| 2018 | $3,586 | $59,550 | $11,490 | $48,060 |
| 2017 | $3,605 | $59,880 | $11,490 | $48,390 |
| 2016 | $3,605 | $59,880 | $11,490 | $48,390 |
| 2015 | $3,486 | $59,880 | $11,490 | $48,390 |
| 2014 | $3,486 | $59,880 | $11,490 | $48,390 |
Source: Public Records
Map
Nearby Homes