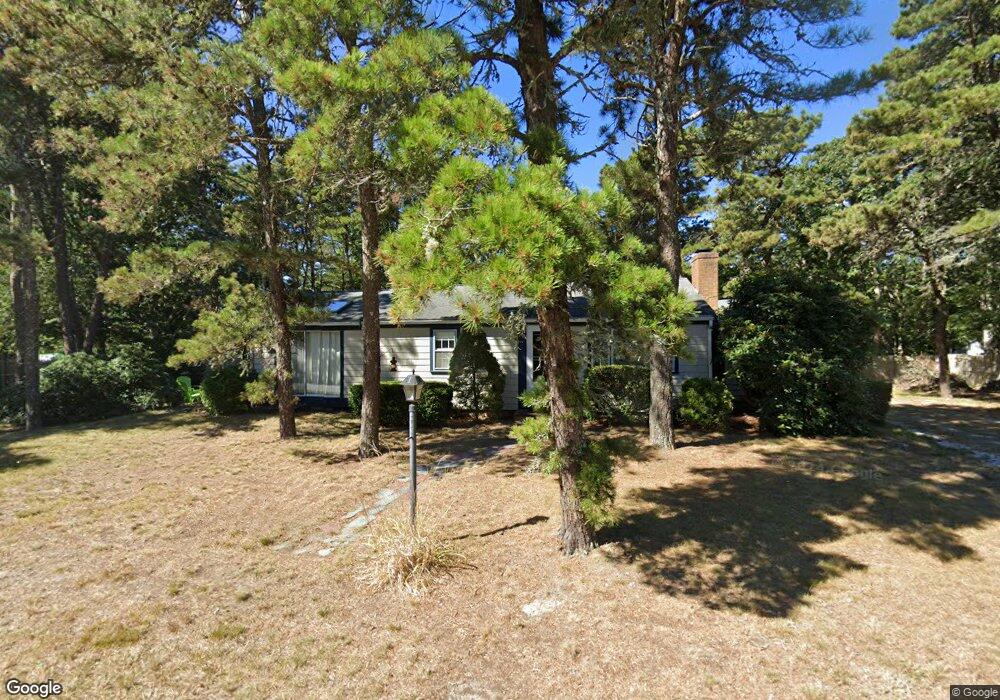
55 Wendward Way West Yarmouth, MA 02673
West Yarmouth NeighborhoodEstimated Value: $515,222 - $528,000
3
Beds
1
Bath
1,124
Sq Ft
$465/Sq Ft
Est. Value
About This Home
This home is located at 55 Wendward Way, West Yarmouth, MA 02673 and is currently estimated at $522,306, approximately $464 per square foot. 55 Wendward Way is a home located in Barnstable County with nearby schools including Dennis-Yarmouth Regional High School, Barnstable Community Horace Mann Charter Public School, and Sturgis Charter Public School.
Ownership History
Date
Name
Owned For
Owner Type
Purchase Details
Closed on
May 19, 2025
Sold by
Griesemer John A
Bought by
John A Griesemer Irt and Youngling
Current Estimated Value
Purchase Details
Closed on
May 27, 2005
Sold by
Ashworth 2Nd Charles D
Bought by
Orr Ardith D and Griesemer John A
Home Financials for this Owner
Home Financials are based on the most recent Mortgage that was taken out on this home.
Original Mortgage
$274,500
Interest Rate
5.94%
Mortgage Type
Purchase Money Mortgage
Purchase Details
Closed on
Jun 29, 2004
Sold by
Phillips Ft and Small
Bought by
Ashworth 2Nd Charles D
Home Financials for this Owner
Home Financials are based on the most recent Mortgage that was taken out on this home.
Original Mortgage
$47,600
Interest Rate
6.32%
Mortgage Type
Purchase Money Mortgage
Purchase Details
Closed on
Sep 27, 1989
Sold by
Flannagan Wm J
Bought by
Phillips Ivan G
Create a Home Valuation Report for This Property
The Home Valuation Report is an in-depth analysis detailing your home's value as well as a comparison with similar homes in the area
Home Values in the Area
Average Home Value in this Area
Purchase History
| Date | Buyer | Sale Price | Title Company |
|---|---|---|---|
| John A Griesemer Irt | -- | -- | |
| John A Griesemer Irt | -- | -- | |
| Orr Ardith D | $305,000 | -- | |
| Orr Ardith D | $305,000 | -- | |
| Ashworth 2Nd Charles D | $238,000 | -- | |
| Ashworth 2Nd Charles D | $238,000 | -- | |
| Phillips Ivan G | $134,000 | -- | |
| Phillips Ivan G | $134,000 | -- |
Source: Public Records
Mortgage History
| Date | Status | Borrower | Loan Amount |
|---|---|---|---|
| Previous Owner | Orr Ardith D | $274,500 | |
| Previous Owner | Ashworth 2Nd Charles D | $47,600 |
Source: Public Records
Tax History Compared to Growth
Tax History
| Year | Tax Paid | Tax Assessment Tax Assessment Total Assessment is a certain percentage of the fair market value that is determined by local assessors to be the total taxable value of land and additions on the property. | Land | Improvement |
|---|---|---|---|---|
| 2025 | $3,032 | $428,200 | $143,100 | $285,100 |
| 2024 | $3,044 | $412,500 | $150,800 | $261,700 |
| 2023 | $2,972 | $366,500 | $134,400 | $232,100 |
| 2022 | $2,801 | $305,100 | $120,900 | $184,200 |
| 2021 | $2,644 | $276,600 | $120,900 | $155,700 |
| 2020 | $2,650 | $265,000 | $120,800 | $144,200 |
| 2019 | $2,461 | $243,700 | $120,800 | $122,900 |
| 2018 | $1,213 | $221,400 | $98,500 | $122,900 |
| 2017 | $2,218 | $221,400 | $98,500 | $122,900 |
| 2016 | $2,120 | $212,400 | $89,500 | $122,900 |
| 2015 | $2,005 | $199,700 | $89,500 | $110,200 |
Source: Public Records
Map
Nearby Homes
- 48 Wendward Way
- 23 Baxter Ave
- 60 Baxter Ave
- 73 Baxter Ave
- 16 Iyannough Rd
- 10 Trenton St
- 0 Ken's Way
- 83 Main St
- 22 Terry Ct
- 14 Brewster Rd
- 110 School St Unit E114
- 110 School St Unit E209
- 110 School St Unit E101
- 15 Webster Rd
- 481 Buck Island Rd Unit 17FA
- 481 Buck Island Rd Unit 9AA
- 115 School St Unit W206
- 18 Rachel Rd
- 15 Mayflower Rd
- 35 Pleasant St