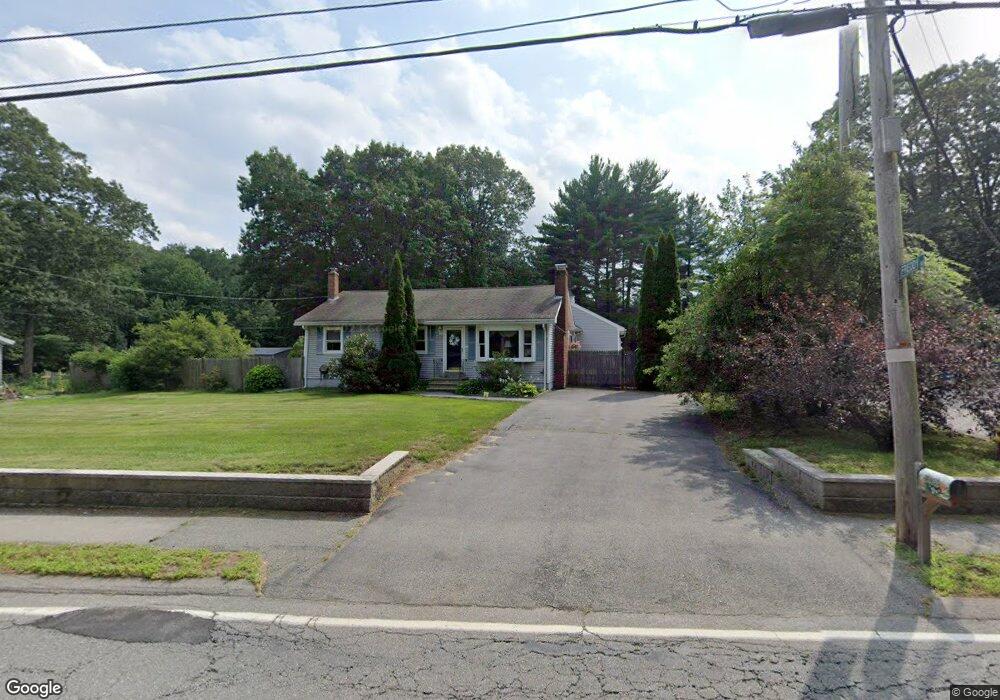
55 Whipple Rd Billerica, MA 01821
Estimated Value: $568,000 - $684,000
3
Beds
1
Bath
1,236
Sq Ft
$511/Sq Ft
Est. Value
About This Home
This home is located at 55 Whipple Rd, Billerica, MA 01821 and is currently estimated at $631,362, approximately $510 per square foot. 55 Whipple Rd is a home located in Middlesex County with nearby schools including Billerica Memorial High School.
Ownership History
Date
Name
Owned For
Owner Type
Purchase Details
Closed on
Nov 30, 2001
Sold by
Cangiamila Dana C and Cangiamila Karen M
Bought by
Briley George P and Briley June A
Current Estimated Value
Purchase Details
Closed on
Aug 31, 1992
Sold by
Brandt James M and Brandt Kathleen
Bought by
Cangiamila Dana C and Cangiamila Karen
Home Financials for this Owner
Home Financials are based on the most recent Mortgage that was taken out on this home.
Original Mortgage
$132,905
Interest Rate
8.09%
Mortgage Type
Purchase Money Mortgage
Create a Home Valuation Report for This Property
The Home Valuation Report is an in-depth analysis detailing your home's value as well as a comparison with similar homes in the area
Purchase History
| Date | Buyer | Sale Price | Title Company |
|---|---|---|---|
| Briley George P | $272,000 | -- | |
| Cangiamila Dana C | $139,900 | -- |
Source: Public Records
Mortgage History
| Date | Status | Borrower | Loan Amount |
|---|---|---|---|
| Previous Owner | Cangiamila Dana C | $131,000 | |
| Previous Owner | Cangiamila Dana C | $132,905 |
Source: Public Records
Tax History
| Year | Tax Paid | Tax Assessment Tax Assessment Total Assessment is a certain percentage of the fair market value that is determined by local assessors to be the total taxable value of land and additions on the property. | Land | Improvement |
|---|---|---|---|---|
| 2025 | $6,116 | $537,900 | $302,900 | $235,000 |
| 2024 | $5,599 | $495,900 | $273,500 | $222,400 |
| 2023 | $5,425 | $457,000 | $238,600 | $218,400 |
| 2022 | $5,031 | $398,000 | $209,300 | $188,700 |
| 2021 | $6,638 | $371,500 | $190,900 | $180,600 |
| 2020 | $4,724 | $363,700 | $183,600 | $180,100 |
| 2019 | $24,869 | $332,700 | $172,600 | $160,100 |
| 2018 | $24,856 | $301,800 | $156,000 | $145,800 |
| 2017 | $4,021 | $285,400 | $150,500 | $134,900 |
| 2016 | $3,969 | $280,700 | $145,800 | $134,900 |
| 2015 | $3,827 | $272,600 | $137,700 | $134,900 |
| 2014 | $3,874 | $271,100 | $136,200 | $134,900 |
Source: Public Records
Map
Nearby Homes
Your Personal Tour Guide
Ask me questions while you tour the home.