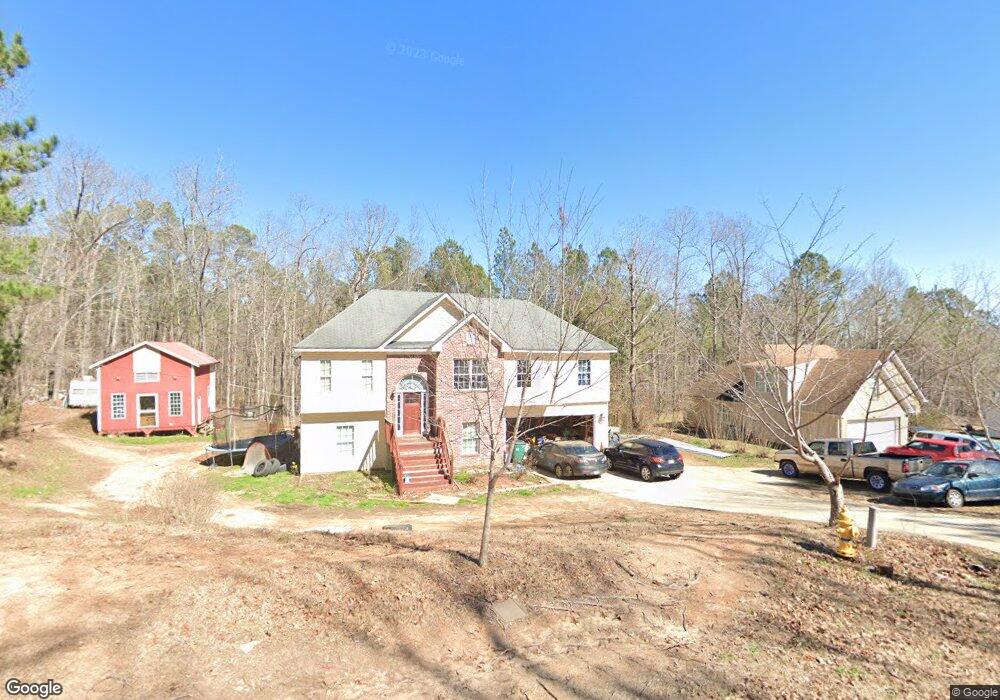
55 Yancey Rd Unit Lot 3 Covington, GA 30014
Estimated Value: $308,000 - $334,000
--
Bed
3
Baths
1,450
Sq Ft
$222/Sq Ft
Est. Value
About This Home
This home is located at 55 Yancey Rd Unit Lot 3, Covington, GA 30014 and is currently estimated at $321,455, approximately $221 per square foot. 55 Yancey Rd Unit Lot 3 is a home located in Newton County with nearby schools including Heard-Mixon Elementary School, Indian Creek Middle School, and Alcovy High School.
Ownership History
Date
Name
Owned For
Owner Type
Purchase Details
Closed on
Dec 2, 2020
Sold by
Jeffries Daniel D
Bought by
Hayes Joseph E and Koeller Autumn M
Current Estimated Value
Home Financials for this Owner
Home Financials are based on the most recent Mortgage that was taken out on this home.
Original Mortgage
$210,101
Outstanding Balance
$187,053
Interest Rate
2.7%
Mortgage Type
New Conventional
Estimated Equity
$134,402
Purchase Details
Closed on
Apr 30, 2007
Sold by
Newton Fedl Bk
Bought by
Jeffries Daniel D and Jeffries Jessica B
Create a Home Valuation Report for This Property
The Home Valuation Report is an in-depth analysis detailing your home's value as well as a comparison with similar homes in the area
Home Values in the Area
Average Home Value in this Area
Purchase History
| Date | Buyer | Sale Price | Title Company |
|---|---|---|---|
| Hayes Joseph E | $208,000 | -- | |
| Jeffries Daniel D | $90,000 | -- |
Source: Public Records
Mortgage History
| Date | Status | Borrower | Loan Amount |
|---|---|---|---|
| Open | Hayes Joseph E | $210,101 |
Source: Public Records
Tax History Compared to Growth
Tax History
| Year | Tax Paid | Tax Assessment Tax Assessment Total Assessment is a certain percentage of the fair market value that is determined by local assessors to be the total taxable value of land and additions on the property. | Land | Improvement |
|---|---|---|---|---|
| 2024 | $2,809 | $114,760 | $11,520 | $103,240 |
| 2023 | $2,568 | $98,520 | $8,080 | $90,440 |
| 2022 | $2,296 | $88,480 | $6,480 | $82,000 |
| 2021 | $2,323 | $80,480 | $6,480 | $74,000 |
| 2020 | $2,390 | $75,040 | $7,200 | $67,840 |
| 2019 | $2,230 | $69,280 | $5,600 | $63,680 |
| 2018 | $2,135 | $66,080 | $5,600 | $60,480 |
| 2017 | $1,907 | $59,440 | $4,000 | $55,440 |
| 2016 | $1,561 | $49,360 | $3,200 | $46,160 |
| 2015 | $1,488 | $47,240 | $3,200 | $44,040 |
| 2014 | $1,388 | $44,400 | $0 | $0 |
Source: Public Records
Map
Nearby Homes
- 125 Yancey Rd
- 135 Yancey Rd
- 50 Birch Rd
- 125 Kendall Ln
- 935 Alcovy Dr N
- 45 Kendall Ln
- 200 Highway 212
- 40 Eryn Terrace
- 215 Eryn Terrace
- 0 Highway 212 Unit Parcel 5
- 0 Highway 212 Unit 10632274
- 0 Highway 212 Unit Parcel 4
- 0 Highway 212 Unit 10632256
- 0 Highway 212 Unit 10632307
- 0 Highway 212 Unit 10632248
- 0 Highway 212 Unit 10632368
- 0 Highway 212 Unit Parcel 7
- 0 Highway 212 Unit 10632315
- 0 Highway 212 Unit Parcel 2
- 0 Highway 212 Unit Parcel 6