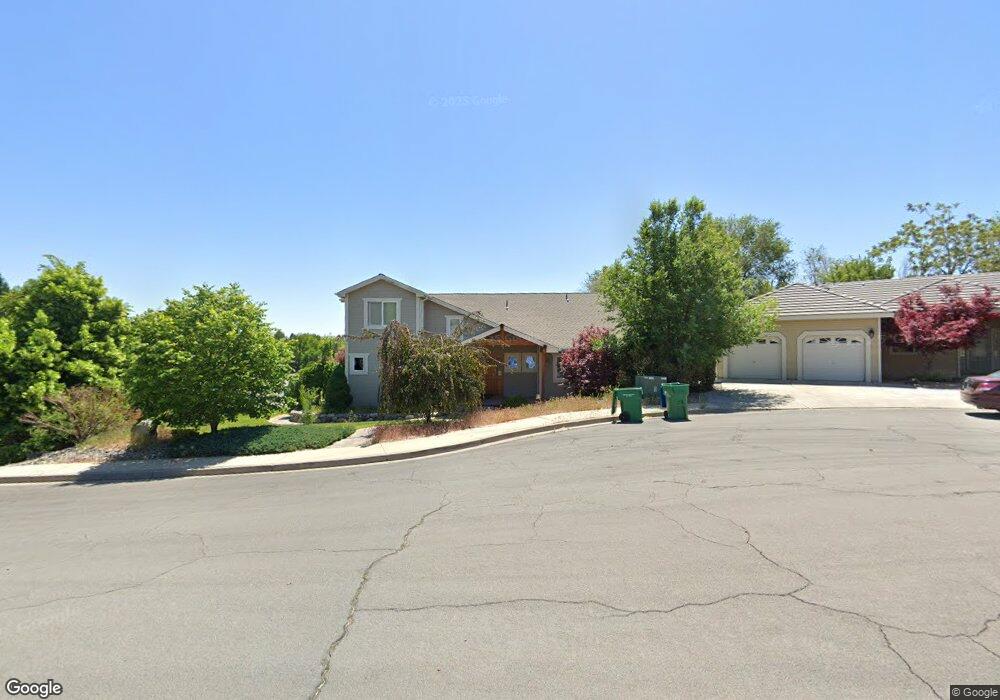
550 Citadel Way Reno, NV 89503
West University NeighborhoodEstimated Value: $728,974 - $925,000
4
Beds
4
Baths
2,610
Sq Ft
$311/Sq Ft
Est. Value
About This Home
This home is located at 550 Citadel Way, Reno, NV 89503 and is currently estimated at $812,994, approximately $311 per square foot. 550 Citadel Way is a home located in Washoe County with nearby schools including Peavine Elementary School, Archie Clayton Pre-AP Academy, and Reno High School.
Ownership History
Date
Name
Owned For
Owner Type
Purchase Details
Closed on
Jun 7, 2013
Sold by
Briscoe Stacy Anne and Hartman Era
Bought by
Briscoe Stacy Anne
Current Estimated Value
Home Financials for this Owner
Home Financials are based on the most recent Mortgage that was taken out on this home.
Original Mortgage
$231,500
Outstanding Balance
$54,467
Interest Rate
4.36%
Mortgage Type
New Conventional
Estimated Equity
$758,527
Purchase Details
Closed on
Dec 24, 2009
Sold by
Olsen Ryan B and Olsen Ashley
Bought by
Briscoe Stacy Anne
Purchase Details
Closed on
Sep 21, 2004
Sold by
Saltern Michael
Bought by
Olsen Ryan B and Olsen Ashley
Purchase Details
Closed on
Mar 9, 1998
Sold by
Anex Ghislaine
Bought by
Anex Jean Claude
Create a Home Valuation Report for This Property
The Home Valuation Report is an in-depth analysis detailing your home's value as well as a comparison with similar homes in the area
Home Values in the Area
Average Home Value in this Area
Purchase History
| Date | Buyer | Sale Price | Title Company |
|---|---|---|---|
| Briscoe Stacy Anne | -- | Servicelink Aliquippa Title | |
| Briscoe Stacy Anne | $325,000 | First Centennial Reno | |
| Olsen Ryan B | $122,500 | Stewart Title Of Northern Nv | |
| Anex Jean Claude | -- | Western Title Company Inc | |
| Anex Jean Claude | $40,000 | Western Title Company Inc |
Source: Public Records
Mortgage History
| Date | Status | Borrower | Loan Amount |
|---|---|---|---|
| Open | Briscoe Stacy Anne | $231,500 |
Source: Public Records
Tax History Compared to Growth
Tax History
| Year | Tax Paid | Tax Assessment Tax Assessment Total Assessment is a certain percentage of the fair market value that is determined by local assessors to be the total taxable value of land and additions on the property. | Land | Improvement |
|---|---|---|---|---|
| 2025 | $5,576 | $167,044 | $47,985 | $119,059 |
| 2024 | $5,576 | $163,874 | $43,960 | $119,914 |
| 2023 | $3,579 | $157,701 | $44,590 | $113,111 |
| 2022 | $4,783 | $133,321 | $39,165 | $94,156 |
| 2021 | $4,427 | $121,511 | $27,860 | $93,651 |
| 2020 | $4,163 | $119,642 | $25,900 | $93,742 |
| 2019 | $4,042 | $116,621 | $24,500 | $92,121 |
| 2018 | $3,939 | $107,984 | $19,075 | $88,909 |
| 2017 | $3,781 | $107,930 | $19,040 | $88,890 |
| 2016 | $3,685 | $107,375 | $17,115 | $90,260 |
| 2015 | $3,679 | $105,226 | $14,770 | $90,456 |
| 2014 | $3,565 | $100,064 | $12,915 | $87,149 |
| 2013 | -- | $94,389 | $9,660 | $84,729 |
Source: Public Records
Map
Nearby Homes
- 1275 Washington St
- 595 College Dr
- 1130 Bon Rea Way
- 250 College Dr
- 1449 Hillside Dr
- 1496 Highland Pines Dr
- 840 Brookfield Dr
- 1341 N Virginia St
- 850 W 11th St
- 960 Ralston St
- 1035 N Sierra St
- 1516 Coleman Dr
- 1480 Grandview Ave
- 1702 Grandview Ave
- 1217 Keystone Ave
- 1415 Kings Row
- 1375 Wesley Dr
- 99 Bartlett St
- 2528 Comstock Dr
- 1835 Marlette Ave
- 520 Choate Ct
- 546 Citadel Way
- 553 Citadel Way
- 540 Citadel Way
- 560 Citadel Way
- 655 College Dr
- 530 Choate Ct
- 559 Citadel Way
- 525 Choate Ct
- 665 College Dr
- 541 Citadel Way
- 645 College Dr
- 675 College Dr
- 635 College Dr
- 635 College Dr Unit NV
- 565 Citadel Way
- 576 Citadel Way
- 685 College Dr
- 535 Colegate Ct
- 625 College Dr