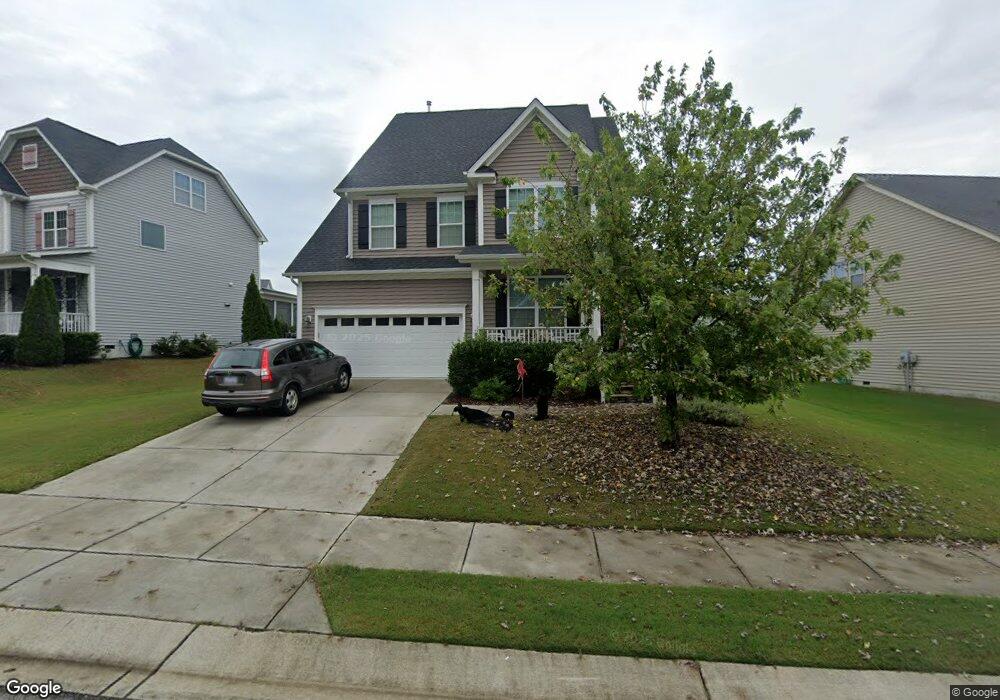
550 Crimson Oak Ln Fuquay Varina, NC 27526
Estimated Value: $512,322 - $551,000
4
Beds
3
Baths
2,691
Sq Ft
$200/Sq Ft
Est. Value
About This Home
This home is located at 550 Crimson Oak Ln, Fuquay Varina, NC 27526 and is currently estimated at $538,831, approximately $200 per square foot. 550 Crimson Oak Ln is a home with nearby schools including Fuquay-Varina High and Southern Wake Academy.
Ownership History
Date
Name
Owned For
Owner Type
Purchase Details
Closed on
Oct 28, 2020
Sold by
Meiburg Grant M and Meiburg Stacie G
Bought by
Burnor John Matthew and Burnor Alyse Robin
Current Estimated Value
Home Financials for this Owner
Home Financials are based on the most recent Mortgage that was taken out on this home.
Original Mortgage
$361,000
Outstanding Balance
$321,815
Interest Rate
2.9%
Mortgage Type
New Conventional
Estimated Equity
$217,016
Purchase Details
Closed on
Mar 17, 2017
Sold by
Hughes Mark E and Hughes Michelle D
Bought by
Meiburg Grant M and Meiburg Stacie G
Home Financials for this Owner
Home Financials are based on the most recent Mortgage that was taken out on this home.
Original Mortgage
$243,525
Interest Rate
4.15%
Mortgage Type
New Conventional
Purchase Details
Closed on
Feb 9, 2016
Sold by
Royal Oaks Building Group Llc
Bought by
Hughes Mark E and Hughes Michelle D
Home Financials for this Owner
Home Financials are based on the most recent Mortgage that was taken out on this home.
Original Mortgage
$283,215
Interest Rate
3.79%
Mortgage Type
FHA
Create a Home Valuation Report for This Property
The Home Valuation Report is an in-depth analysis detailing your home's value as well as a comparison with similar homes in the area
Home Values in the Area
Average Home Value in this Area
Purchase History
| Date | Buyer | Sale Price | Title Company |
|---|---|---|---|
| Burnor John Matthew | $361,000 | None Available | |
| Meiburg Grant M | $287,000 | None Available | |
| Hughes Mark E | $288,500 | None Available |
Source: Public Records
Mortgage History
| Date | Status | Borrower | Loan Amount |
|---|---|---|---|
| Open | Burnor John Matthew | $361,000 | |
| Previous Owner | Meiburg Grant M | $243,525 | |
| Previous Owner | Hughes Mark E | $283,215 |
Source: Public Records
Tax History Compared to Growth
Tax History
| Year | Tax Paid | Tax Assessment Tax Assessment Total Assessment is a certain percentage of the fair market value that is determined by local assessors to be the total taxable value of land and additions on the property. | Land | Improvement |
|---|---|---|---|---|
| 2025 | $4,186 | $476,061 | $90,000 | $386,061 |
| 2024 | $4,169 | $476,061 | $90,000 | $386,061 |
| 2023 | $3,659 | $327,217 | $65,000 | $262,217 |
| 2022 | $3,438 | $327,217 | $65,000 | $262,217 |
| 2021 | $3,276 | $327,217 | $65,000 | $262,217 |
| 2020 | $3,276 | $327,217 | $65,000 | $262,217 |
| 2019 | $3,133 | $269,973 | $60,000 | $209,973 |
| 2018 | $2,896 | $264,646 | $60,000 | $204,646 |
| 2017 | $2,792 | $268,196 | $60,000 | $208,196 |
| 2016 | $1,910 | $60,000 | $60,000 | $0 |
Source: Public Records
Map
Nearby Homes
- 498 Walker Ranch Dr
- 1152 Summer Meadow Dr
- 1108 Summer Meadow Dr
- 701 Laurel Spring Dr
- 713 Laurel Spring Dr
- 885 Wilbon Rd
- Jackson Plan at Madden West
- Calhoun Plan at Madden West
- BLAKELY Plan at Madden West - The Townes
- Alec Plan at Madden West
- HADLEIGH Plan at Madden West - The Townes
- 945 Wilbon Rd
- 1504 Maelyn Way
- Cooper Plan at Broadwell Trace - Broadwell Estates
- Cypress Plan at Broadwell Trace - Broadwell Estates
- 738 Dorset Stream Dr
- 764 Dorset Stream Dr
- 766 Dorset Stream Dr
- 736 Dorset Stream Dr
- 734 Dorset Stream Dr
- 556 Crimson Oak Ln
- 542 Crimson Oak Ln
- 533 Walker Ranch Dr
- 536 Crimson Oak Ln
- 560 Crimson Oak Ln
- 549 Crimson Oak Ln
- 545 Crimson Oak Ln
- 553 Crimson Oak Ln
- 529 Walker Ranch Dr
- 532 Crimson Oak Ln
- 557 Crimson Oak Ln
- 535 Crimson Oak Ln
- 564 Crimson Oak Ln
- 561 Crimson Oak Ln
- 536 Walker Ranch Dr
- 540 Walker Ranch Dr
- 531 Crimson Oak Ln
- 532 Walker Ranch Dr
- 495 Walker
- 532 Walker