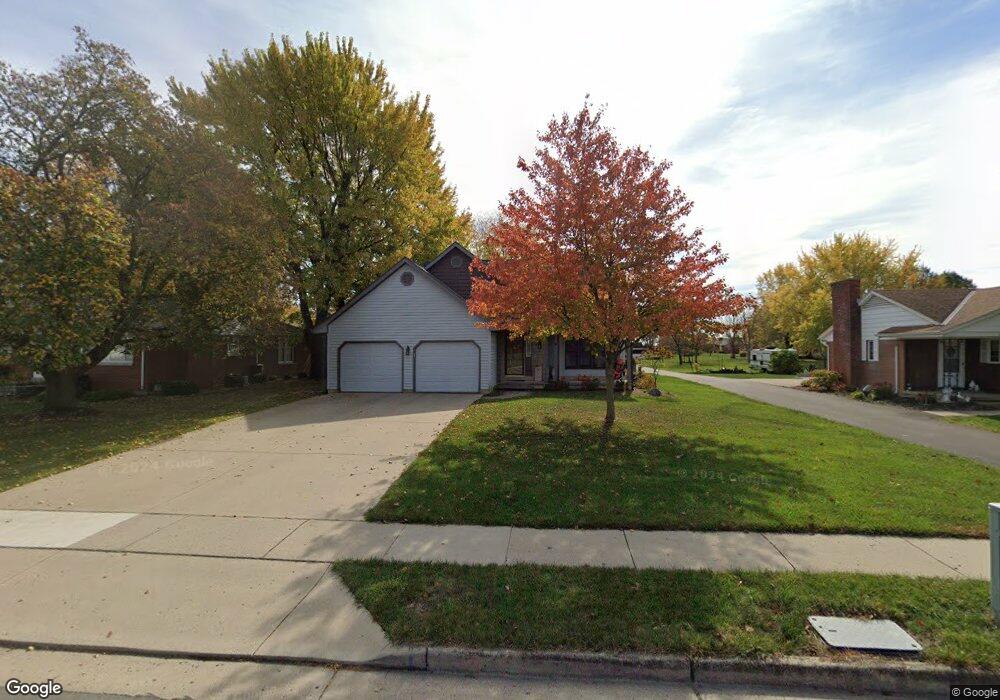
550 E 4th St Minster, OH 45865
Estimated Value: $319,582 - $388,000
2
Beds
2
Baths
1,771
Sq Ft
$199/Sq Ft
Est. Value
About This Home
This home is located at 550 E 4th St, Minster, OH 45865 and is currently estimated at $352,896, approximately $199 per square foot. 550 E 4th St is a home located in Auglaize County with nearby schools including Minster Elementary School, Minster Junior/Senior High School, and St Augustine Religious School.
Ownership History
Date
Name
Owned For
Owner Type
Purchase Details
Closed on
Nov 8, 2016
Sold by
Sherman Scott R and Sherman Kimberly E
Bought by
Otting Cory D and Otting Kayla S
Current Estimated Value
Home Financials for this Owner
Home Financials are based on the most recent Mortgage that was taken out on this home.
Original Mortgage
$182,400
Outstanding Balance
$145,251
Interest Rate
3.42%
Mortgage Type
New Conventional
Estimated Equity
$207,645
Purchase Details
Closed on
Jul 8, 2011
Sold by
Drake Timothy S
Bought by
Sherman Scott R and Pleiman Kimberly E
Home Financials for this Owner
Home Financials are based on the most recent Mortgage that was taken out on this home.
Original Mortgage
$149,900
Interest Rate
4.56%
Mortgage Type
New Conventional
Purchase Details
Closed on
Apr 5, 2004
Sold by
Drake John R
Bought by
Drake Vinnie M
Purchase Details
Closed on
Sep 1, 1993
Purchase Details
Closed on
Feb 10, 1993
Sold by
Ruley Harold
Bought by
Drake John R
Create a Home Valuation Report for This Property
The Home Valuation Report is an in-depth analysis detailing your home's value as well as a comparison with similar homes in the area
Home Values in the Area
Average Home Value in this Area
Purchase History
| Date | Buyer | Sale Price | Title Company |
|---|---|---|---|
| Otting Cory D | $192,000 | Attorney | |
| Sherman Scott R | $159,900 | Attorney | |
| Drake Vinnie M | -- | -- | |
| -- | $135,000 | -- | |
| Drake John R | $21,000 | -- |
Source: Public Records
Mortgage History
| Date | Status | Borrower | Loan Amount |
|---|---|---|---|
| Open | Otting Cory D | $182,400 | |
| Previous Owner | Sherman Scott R | $149,900 |
Source: Public Records
Tax History
| Year | Tax Paid | Tax Assessment Tax Assessment Total Assessment is a certain percentage of the fair market value that is determined by local assessors to be the total taxable value of land and additions on the property. | Land | Improvement |
|---|---|---|---|---|
| 2025 | $6,029 | $86,780 | $15,610 | $71,170 |
| 2024 | $6,029 | $86,780 | $15,610 | $71,170 |
| 2023 | $2,938 | $86,780 | $15,610 | $71,170 |
| 2022 | $2,459 | $67,410 | $14,180 | $53,230 |
| 2021 | $2,511 | $67,410 | $14,180 | $53,230 |
| 2020 | $1,292 | $67,403 | $14,175 | $53,228 |
| 2019 | $2,266 | $55,510 | $11,627 | $43,883 |
| 2018 | $2,266 | $55,510 | $11,627 | $43,883 |
| 2017 | $2,102 | $55,510 | $11,627 | $43,883 |
| 2016 | $2,008 | $51,815 | $10,665 | $41,150 |
| 2015 | $1,973 | $51,815 | $10,665 | $41,150 |
| 2014 | $1,976 | $51,815 | $10,665 | $41,150 |
| 2013 | $2,072 | $51,815 | $10,665 | $41,150 |
Source: Public Records
Map
Nearby Homes
- 0 Stonegate Dr Unit 14 10544847
- 0 Stonegate Dr Unit 21 10544857
- 7 E 2nd St
- 17 Stonegate Dr
- 36 Shania Place Unit 23
- 28 Shania Place Unit 33
- 19 Shania Place Unit 33
- 27 Shania Place Unit 26
- 5761 Fisher & Koverman Rd
- 610 S Walnut St
- 561 S Walnut St Unit Lot3
- 1991 Minster Egypt Pike
- 137 Janice Dr
- 130 Janice Dr
- 149 Janice Dr
- 145 Janice Dr
- 141 Janice Dr
- 153 Janice Dr
- 157 Janice Dr
- 132 Janice Dr
- 566 E 4th St Unit 1
- 542 E 4th St Unit 1
- 21 S Webster St
- 534 E 4th St Unit 1
- 29 S Webster St
- 526 E 4th St
- 30 S Hamilton St
- 38 S Hamilton St
- 45 S Webster St
- 625 E 4th St
- 12215 Short Dr
- 11 Crestwood Dr
- 46 S Hamilton St
- 493 E 4th St
- 22 S Webster St
- 53 S Webster St
- 23 Crestwood Dr
- 38 S Webster St
- 54 S Hamilton St
- 31 N Hamilton St
Your Personal Tour Guide
Ask me questions while you tour the home.