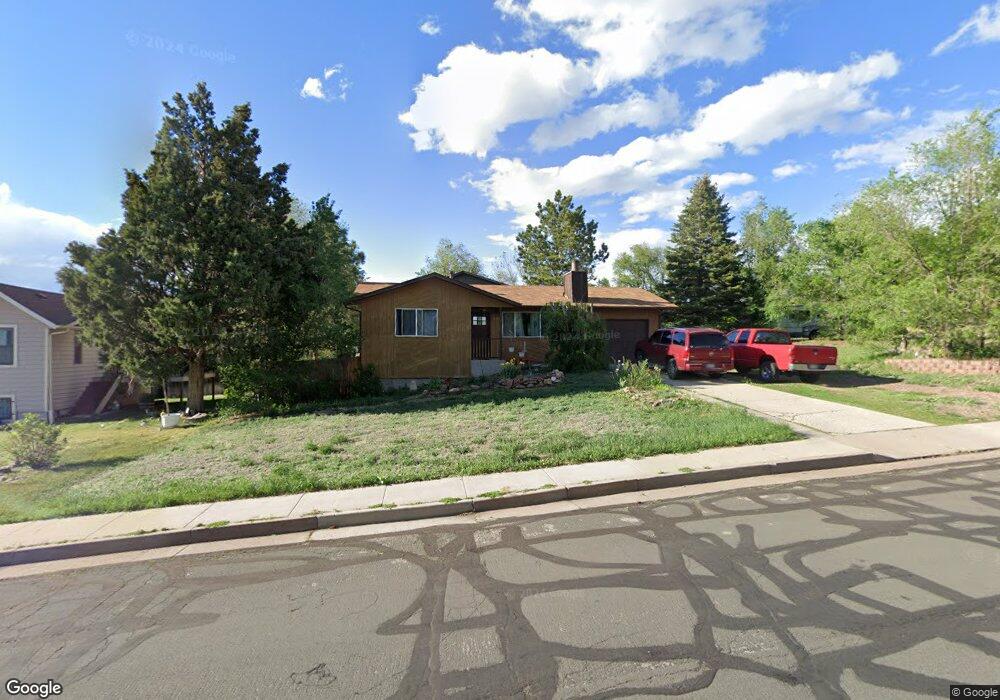
550 E Moreno Ave Colorado Springs, CO 80903
Hillside NeighborhoodEstimated Value: $300,000 - $347,252
2
Beds
1
Bath
876
Sq Ft
$379/Sq Ft
Est. Value
About This Home
This home is located at 550 E Moreno Ave, Colorado Springs, CO 80903 and is currently estimated at $332,063, approximately $379 per square foot. 550 E Moreno Ave is a home located in El Paso County with nearby schools including Adams Elementary School, North Middle School, and William J. Palmer High School.
Ownership History
Date
Name
Owned For
Owner Type
Purchase Details
Closed on
May 20, 2013
Sold by
Sparrow Inc
Bought by
Neal Steven D
Current Estimated Value
Home Financials for this Owner
Home Financials are based on the most recent Mortgage that was taken out on this home.
Original Mortgage
$121,250
Outstanding Balance
$86,227
Interest Rate
3.56%
Mortgage Type
New Conventional
Estimated Equity
$245,836
Purchase Details
Closed on
Oct 3, 2012
Sold by
Ohlbrecht Brody M
Bought by
Sparrow Inc
Purchase Details
Closed on
Dec 16, 2002
Sold by
Ohlbrecht Brody M and Ohlbrecht Rickey L
Bought by
Ohlbrecht Brody M
Home Financials for this Owner
Home Financials are based on the most recent Mortgage that was taken out on this home.
Original Mortgage
$110,990
Interest Rate
6.05%
Mortgage Type
FHA
Purchase Details
Closed on
Apr 9, 1992
Bought by
Neal Steven D
Purchase Details
Closed on
Oct 1, 1985
Bought by
Neal Steven D
Purchase Details
Closed on
Sep 1, 1980
Bought by
Neal Steven D
Create a Home Valuation Report for This Property
The Home Valuation Report is an in-depth analysis detailing your home's value as well as a comparison with similar homes in the area
Home Values in the Area
Average Home Value in this Area
Purchase History
| Date | Buyer | Sale Price | Title Company |
|---|---|---|---|
| Neal Steven D | $125,000 | Heritage Title | |
| Sparrow Inc | -- | None Available | |
| Ohlbrecht Brody M | -- | -- | |
| Ohlbrecht Brody M | $112,000 | -- | |
| Neal Steven D | -- | -- | |
| Neal Steven D | -- | -- | |
| Neal Steven D | -- | -- |
Source: Public Records
Mortgage History
| Date | Status | Borrower | Loan Amount |
|---|---|---|---|
| Open | Neal Steven D | $121,250 | |
| Previous Owner | Ohlbrecht Brody M | $110,990 |
Source: Public Records
Tax History Compared to Growth
Tax History
| Year | Tax Paid | Tax Assessment Tax Assessment Total Assessment is a certain percentage of the fair market value that is determined by local assessors to be the total taxable value of land and additions on the property. | Land | Improvement |
|---|---|---|---|---|
| 2025 | $1,078 | $23,590 | -- | -- |
| 2024 | $968 | $23,800 | $2,730 | $21,070 |
| 2022 | $923 | $16,490 | $2,530 | $13,960 |
| 2021 | $1,001 | $16,960 | $2,600 | $14,360 |
| 2020 | $908 | $13,380 | $2,000 | $11,380 |
| 2019 | $903 | $13,380 | $2,000 | $11,380 |
| 2018 | $728 | $9,920 | $1,730 | $8,190 |
| 2017 | $689 | $9,920 | $1,730 | $8,190 |
| 2016 | $581 | $10,020 | $1,990 | $8,030 |
| 2015 | $579 | $10,020 | $1,990 | $8,030 |
| 2014 | $418 | $6,940 | $1,910 | $5,030 |
Source: Public Records
Map
Nearby Homes
- 703 E Costilla St
- 710 S Royer St
- 529 S Prospect St
- 801 E Costilla St
- 314 S El Paso St
- 312 S El Paso St
- 310 S El Paso St
- 308 S El Paso St
- 725 E Las Animas St
- 735 E Vermijo Ave
- 917 E Cimarron St
- 312 E Cimarron St
- 909 E Costilla St
- 915 S El Paso St
- 832 E Vermijo Ave
- 828 S Wahsatch Ave
- 834 S Wahsatch Ave
- 944 E Moreno Ave Unit A & B
- 847 Victoria Ridge Point
- 909 S Arcadia St
- 520 Melvin M Cir
- 540 E Moreno Ave
- 525 Obyrne Ct
- 570 E Moreno Ave
- 545 E Moreno Ave
- 533 E Moreno Ave
- 551 E Moreno Ave
- 515 Obyrne Ct
- 515 Melvin M Cir
- 525 Melvin M Cir
- 527 E Moreno Ave
- 604 S El Paso St
- 551 E Cimarron St Unit 4
- 549 E Cimarron St Unit A3
- 520 E Moreno Ave
- 510 Obyrne Ct
- 608 S El Paso St
- 520 Obyrne Ct
- 547 E Cimarron St Unit 2
- 545 E Cimarron St Unit 1