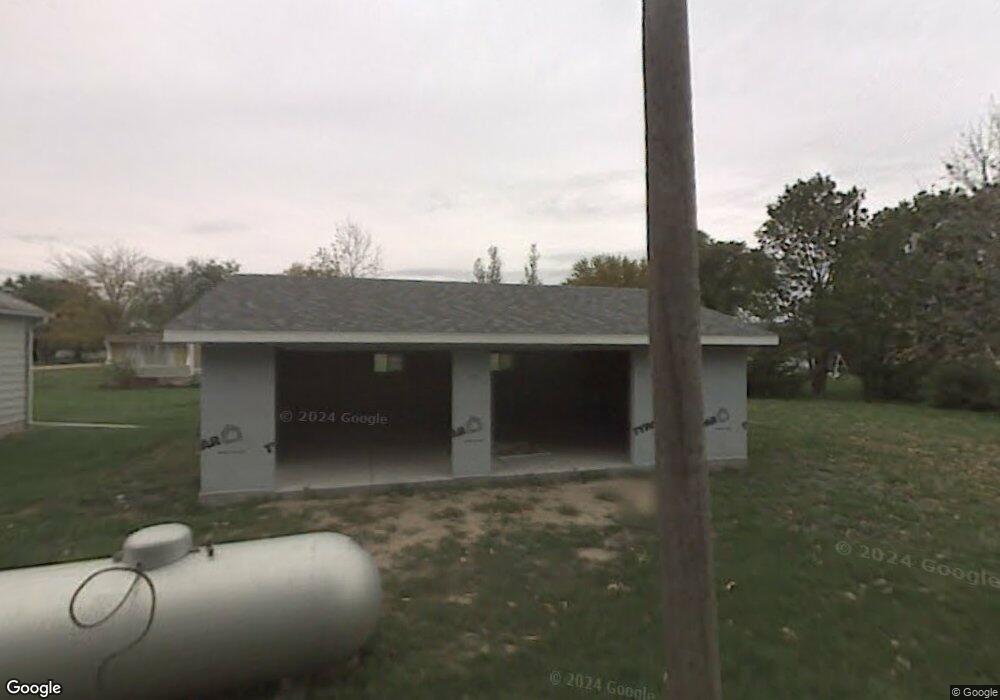
550 Oak St Gresham, NE 68367
Estimated Value: $81,000 - $108,000
Studio
--
Bath
728
Sq Ft
$132/Sq Ft
Est. Value
About This Home
This home is located at 550 Oak St, Gresham, NE 68367 and is currently estimated at $96,151, approximately $132 per square foot. 550 Oak St is a home with nearby schools including Centennial Elementary School and Centennial High School.
Ownership History
Date
Name
Owned For
Owner Type
Purchase Details
Closed on
Jun 14, 2018
Sold by
Gorey Shane and Kraft Joshua
Bought by
Patchin Travis
Current Estimated Value
Home Financials for this Owner
Home Financials are based on the most recent Mortgage that was taken out on this home.
Original Mortgage
$30,400
Outstanding Balance
$26,124
Interest Rate
4.5%
Mortgage Type
Adjustable Rate Mortgage/ARM
Estimated Equity
$70,027
Purchase Details
Closed on
Dec 2, 2010
Sold by
Heser Chad R
Bought by
Schmit Robert L
Purchase Details
Closed on
Nov 7, 2002
Sold by
Clauson Joyce C
Bought by
Heser Chad
Purchase Details
Closed on
Jun 4, 2002
Sold by
Hennessey Kathryn
Bought by
Clauson Joyce C
Create a Home Valuation Report for This Property
The Home Valuation Report is an in-depth analysis detailing your home's value as well as a comparison with similar homes in the area
Purchase History
| Date | Buyer | Sale Price | Title Company |
|---|---|---|---|
| Patchin Travis | $32,000 | Title Services | |
| Schmit Robert L | $25,000 | -- | |
| Heser Chad | $12,500 | -- | |
| Clauson Joyce C | $10,000 | -- |
Source: Public Records
Mortgage History
| Date | Status | Borrower | Loan Amount |
|---|---|---|---|
| Open | Patchin Travis | $30,400 |
Source: Public Records
Tax History
| Year | Tax Paid | Tax Assessment Tax Assessment Total Assessment is a certain percentage of the fair market value that is determined by local assessors to be the total taxable value of land and additions on the property. | Land | Improvement |
|---|---|---|---|---|
| 2025 | $576 | $54,621 | $5,050 | $49,571 |
| 2024 | $438 | $33,315 | $1,278 | $32,037 |
| 2023 | $514 | $36,875 | $1,278 | $35,597 |
| 2022 | $515 | $37,449 | $1,278 | $36,171 |
| 2021 | $497 | $36,740 | $1,278 | $35,462 |
| 2020 | $446 | $33,963 | $1,278 | $32,685 |
| 2019 | $428 | $32,982 | $1,278 | $31,704 |
| 2018 | $427 | $33,549 | $1,278 | $32,271 |
| 2017 | $382 | $30,097 | $1,008 | $29,089 |
| 2016 | $371 | $30,145 | $1,056 | $29,089 |
| 2015 | $366 | $30,097 | $1,008 | $29,089 |
| 2014 | $375 | $30,097 | $1,008 | $29,089 |
Source: Public Records
Map
Nearby Homes
- 2307 Nebraska 69
- 0002 Rock Creek Rd
- 0001 Rock Creek Rd
- 0003 Rock Creek Rd
- 300 2nd St
- 303 Stafford St
- 402 Gordon St
- 141 Bronco Cir
- 230 N 5th St
- 300 2nd Ave
- 1002 E 5th St
- 440 W Pine St
- 550 W Pine St Unit N Willow S
- 600 W Pine St
- 330 W Cherry St
- 455 N Cedar St
- 210 W Washington St
- 405 E 6th St
- 215 E 6th St
- 107 E 7th St
Your Personal Tour Guide
Ask me questions while you tour the home.