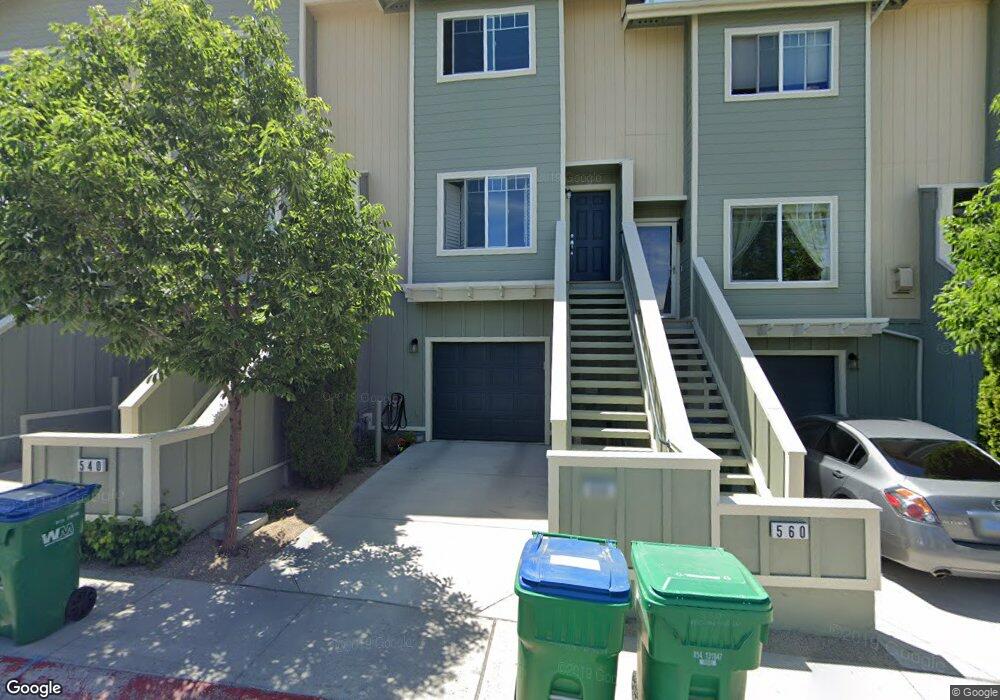
550 Preston Burr Ln Unit 16 Reno, NV 89503
Panther Valley NeighborhoodEstimated Value: $363,000 - $464,544
2
Beds
3
Baths
1,349
Sq Ft
$295/Sq Ft
Est. Value
About This Home
This home is located at 550 Preston Burr Ln Unit 16, Reno, NV 89503 and is currently estimated at $397,636, approximately $294 per square foot. 550 Preston Burr Ln Unit 16 is a home located in Washoe County with nearby schools including Elmcrest Elementary School, Archie Clayton Middle School, and Coral Academy Charter School Elementary.
Ownership History
Date
Name
Owned For
Owner Type
Purchase Details
Closed on
Mar 9, 2022
Sold by
Zavacky Michael L
Bought by
Poland Hayley
Current Estimated Value
Home Financials for this Owner
Home Financials are based on the most recent Mortgage that was taken out on this home.
Original Mortgage
$340,000
Outstanding Balance
$315,954
Interest Rate
3.92%
Mortgage Type
New Conventional
Estimated Equity
$81,682
Purchase Details
Closed on
Dec 11, 2006
Sold by
Rancho San Rafael Iii Llc
Bought by
Zavacky Michael L
Home Financials for this Owner
Home Financials are based on the most recent Mortgage that was taken out on this home.
Original Mortgage
$187,900
Interest Rate
6.25%
Mortgage Type
Unknown
Create a Home Valuation Report for This Property
The Home Valuation Report is an in-depth analysis detailing your home's value as well as a comparison with similar homes in the area
Home Values in the Area
Average Home Value in this Area
Purchase History
| Date | Buyer | Sale Price | Title Company |
|---|---|---|---|
| Poland Hayley | $425,000 | Ticor Title | |
| Zavacky Michael L | $235,000 | Western Title Incorporated |
Source: Public Records
Mortgage History
| Date | Status | Borrower | Loan Amount |
|---|---|---|---|
| Open | Poland Hayley | $340,000 | |
| Previous Owner | Zavacky Michael L | $187,900 |
Source: Public Records
Tax History Compared to Growth
Tax History
| Year | Tax Paid | Tax Assessment Tax Assessment Total Assessment is a certain percentage of the fair market value that is determined by local assessors to be the total taxable value of land and additions on the property. | Land | Improvement |
|---|---|---|---|---|
| 2025 | $1,497 | $81,221 | $27,440 | $53,781 |
| 2024 | $1,455 | $79,580 | $24,325 | $55,255 |
| 2023 | $1,455 | $76,968 | $26,705 | $50,263 |
| 2022 | $1,413 | $64,561 | $22,260 | $42,301 |
| 2021 | $1,372 | $60,188 | $18,095 | $42,093 |
| 2020 | $1,288 | $60,576 | $17,710 | $42,866 |
| 2019 | $1,227 | $57,426 | $16,485 | $40,941 |
| 2018 | $1,171 | $51,922 | $11,935 | $39,987 |
| 2017 | $1,124 | $50,933 | $11,270 | $39,663 |
| 2016 | $1,096 | $49,513 | $9,555 | $39,958 |
| 2015 | $1,093 | $49,048 | $8,155 | $40,893 |
| 2014 | $1,062 | $37,887 | $6,755 | $31,132 |
| 2013 | -- | $28,077 | $4,795 | $23,282 |
Source: Public Records
Map
Nearby Homes
- 4179 Amber Marie Ln
- 4592 Kathleen Denise Ln
- 4795 Ciarra Kennedy Ln
- 585 Logan Jacob Ln
- 147 Vista Rafael Pkwy
- 139 Vista Rafael Pkwy Unit 53
- 230 Bisset Ct Unit B
- 41 Vista Rafael Pkwy
- 31 Vista Rafael Pkwy
- 140 Griswold Way Unit C
- 3696 Shale Ct
- 200 Talus Way Unit 123
- 200 Talus Way Unit 232
- 200 Talus Way Unit 522
- 380 Hoge Rd
- 390 Hoge Rd
- 375 Hoge Rd
- 4955 Emery Dr
- 531 Tarn Way
- 400 Tarn Way
- 560 Preston Burr Ln Unit 15
- 560 Preston Burr Ln
- 570 Preston Burr Ln Unit 14
- 570 Preston Burr Ln
- 550 Preston Burr Ln
- 580 Preston Burr Ln Unit 13
- 580 Preston Burr Ln
- 540 Preston Burr Ln Unit 17
- 540 Preston Burr Ln
- 530 Preston Burr Ln Unit 18
- 530 Preston Burr Ln
- 560 Madeline Jane Ln
- 490 Preston Burr Ln Unit 19
- 490 Preston Burr Ln
- 550 Madeline Jane Ln
- 625 Madeline Jane Ln Unit 9
- 480 Preston Burr Ln Unit 20
- 480 Preston Burr Ln
- 645 Madeline Jane Ln Unit 11
- 645 Madeline Jane Ln