
Seller's Agent in 2025
Marcia Lyman
Brown Harris Stevens
(857) 492-1077
3 in this area
7 Total Sales
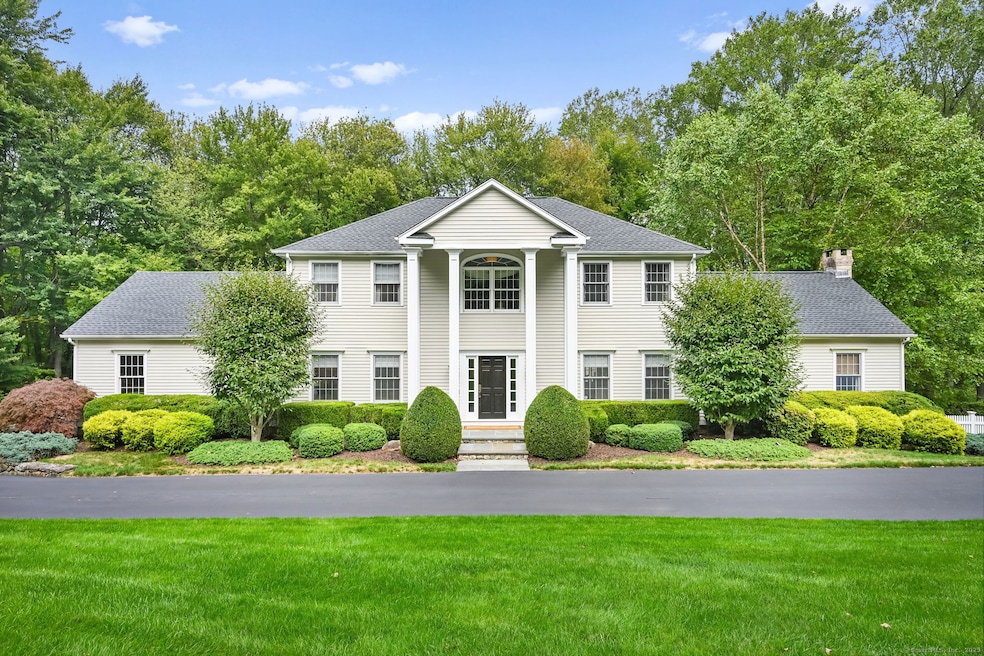
Welcome to this beautifully updated 4+ bedroom Colonial in a sought-after Greenfield Hill neighborhood, surrounded by rolling lawns and tree-lined streets. Offering over 3,000 sq. ft. of elegant living space plus 1,000+ sq. ft. in the spacious finished walk-out lower level, this home provides exceptional versatility and comfort. The grand entryway opens to a formal living and dining room with custom built-ins. The inviting family room, with vaulted ceilings and a natural stone fireplace, flows seamlessly into the impeccably updated eat-in kitchen. From here, sliding doors lead to an expansive Trex deck with a built-in gas grill, perfect for indoor/outdoor entertaining against the backdrop of a serene, private wooded yard. A mudroom, laundry area, and powder room complete the first floor. Upstairs, the tranquil primary suite features a walk-in closet and a spa-like bath with soaking tub, stall shower, and double vanity. Three additional bedrooms and a full bath complete the second level. The finished lower level includes a bedroom/office/potential au pair suite with full bath, ample storage, and walk-out access. Notable upgrades include fresh interior and exterior paint (2025), new roof (2024), remodeled kitchen and primary bath (2023), refinished hardwood floors (2023), and driveway sealing (2023). Meticulously maintained mechanicals and thoughtful updates make this home truly move-in ready.
Last Agent to Sell the Property
Brown Harris Stevens Brokerage Phone: (857) 492-1077 License #RES.0815232 Listed on: 09/15/2025
| Date | Type | Sale Price | Title Company |
|---|---|---|---|
| Deed | $1,600,000 | -- | |
| Quit Claim Deed | -- | -- | |
| Quit Claim Deed | -- | -- | |
| Warranty Deed | $660,000 | -- | |
| Warranty Deed | $660,000 | -- | |
| Warranty Deed | $645,000 | -- | |
| Warranty Deed | $645,000 | -- | |
| Warranty Deed | $619,000 | -- | |
| Warranty Deed | $619,000 | -- | |
| Warranty Deed | $180,000 | -- | |
| Warranty Deed | $180,000 | -- |
| Date | Status | Loan Amount | Loan Type |
|---|---|---|---|
| Open | $1,200,000 | New Conventional | |
| Previous Owner | $237,000 | No Value Available | |
| Previous Owner | $257,405 | No Value Available |
| Date | Event | Price | List to Sale | Price per Sq Ft |
|---|---|---|---|---|
| 11/14/2025 11/14/25 | Sold | $1,600,000 | -3.0% | $386 / Sq Ft |
| 10/10/2025 10/10/25 | Pending | -- | -- | -- |
| 09/17/2025 09/17/25 | For Sale | $1,650,000 | -- | $398 / Sq Ft |
| Year | Tax Paid | Tax Assessment Tax Assessment Total Assessment is a certain percentage of the fair market value that is determined by local assessors to be the total taxable value of land and additions on the property. | Land | Improvement |
|---|---|---|---|---|
| 2025 | $15,602 | $549,570 | $246,120 | $303,450 |
| 2024 | $15,333 | $549,570 | $246,120 | $303,450 |
| 2023 | $15,119 | $549,570 | $246,120 | $303,450 |
| 2022 | $14,970 | $549,570 | $246,120 | $303,450 |
| 2021 | $14,827 | $549,570 | $246,120 | $303,450 |
| 2020 | $17,692 | $660,380 | $314,720 | $345,660 |
| 2019 | $17,692 | $660,380 | $314,720 | $345,660 |
| 2018 | $17,408 | $660,380 | $314,720 | $345,660 |
| 2017 | $17,051 | $660,380 | $314,720 | $345,660 |
| 2016 | $16,807 | $660,380 | $314,720 | $345,660 |
| 2015 | $18,051 | $728,140 | $342,230 | $385,910 |
| 2014 | $17,767 | $728,140 | $342,230 | $385,910 |
Seller's Agent in 2025
Marcia Lyman
Brown Harris Stevens
(857) 492-1077
3 in this area
7 Total Sales
Seller Co-Listing Agent in 2025
Annie Kruger
Brown Harris Stevens
(646) 712-4461
6 in this area
45 Total Sales
Buyer's Agent in 2025
Michael Traum
RE/MAX
(203) 981-7554
1 in this area
38 Total Sales
Source: SmartMLS
MLS Number: 24126270
APN: FAIR-000067-000000-000015-N000000
Disclaimer: Certain information contained herein is derived from information provided by parties other than Homes.com. All information provided is deemed reliable, but is not guaranteed to be accurate and should be independently verified.
![]() IDX information is provided exclusively for personal, non-commercial use, and may not be used for any purpose other than to identify prospective properties consumers may be interested in purchasing. Information is deemed reliable but not guaranteed.
IDX information is provided exclusively for personal, non-commercial use, and may not be used for any purpose other than to identify prospective properties consumers may be interested in purchasing. Information is deemed reliable but not guaranteed.
Ask me questions while you tour the home.