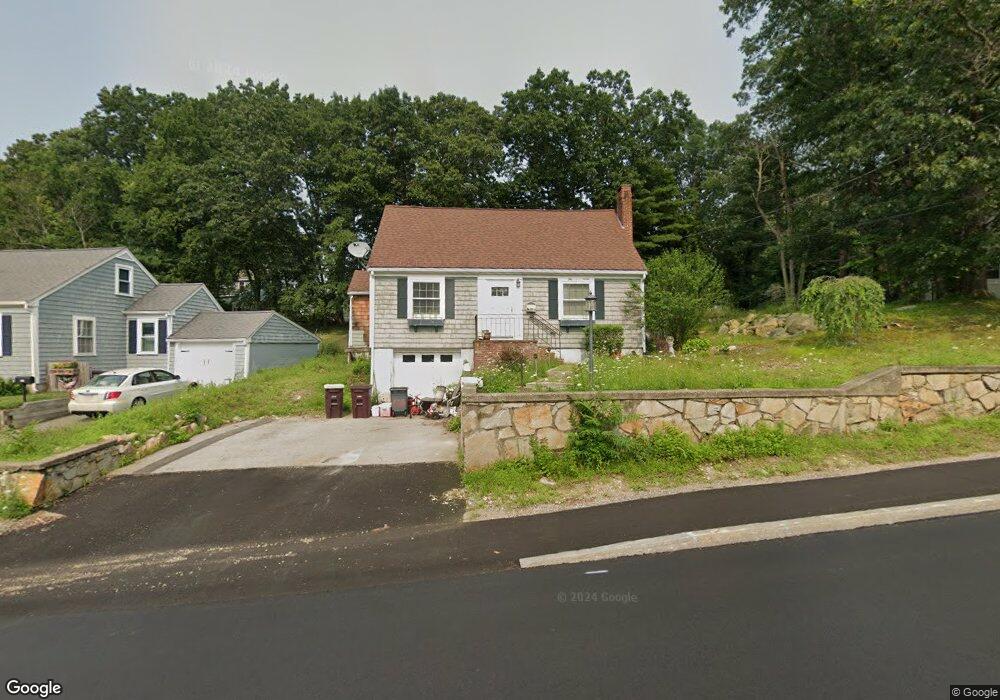
550 Summer St Weymouth, MA 02188
South Weymouth NeighborhoodEstimated Value: $580,000 - $668,000
3
Beds
2
Baths
1,500
Sq Ft
$414/Sq Ft
Est. Value
About This Home
This home is located at 550 Summer St, Weymouth, MA 02188 and is currently estimated at $620,456, approximately $413 per square foot. 550 Summer St is a home located in Norfolk County with nearby schools including Frederick C Murphy, Abigail Adams Middle School, and Weymouth Middle School Chapman.
Ownership History
Date
Name
Owned For
Owner Type
Purchase Details
Closed on
Dec 13, 1996
Sold by
Annis Tr Eva J
Bought by
Mcauley Janet
Current Estimated Value
Home Financials for this Owner
Home Financials are based on the most recent Mortgage that was taken out on this home.
Original Mortgage
$80,000
Outstanding Balance
$8,169
Interest Rate
7.75%
Mortgage Type
Purchase Money Mortgage
Estimated Equity
$612,287
Purchase Details
Closed on
Dec 4, 1995
Sold by
Clark Alice L
Bought by
Annis Tr Eva J
Create a Home Valuation Report for This Property
The Home Valuation Report is an in-depth analysis detailing your home's value as well as a comparison with similar homes in the area
Home Values in the Area
Average Home Value in this Area
Purchase History
| Date | Buyer | Sale Price | Title Company |
|---|---|---|---|
| Mcauley Janet | $143,000 | -- | |
| Annis Tr Eva J | $120,000 | -- |
Source: Public Records
Mortgage History
| Date | Status | Borrower | Loan Amount |
|---|---|---|---|
| Open | Mcauley Janet | $80,000 |
Source: Public Records
Tax History Compared to Growth
Tax History
| Year | Tax Paid | Tax Assessment Tax Assessment Total Assessment is a certain percentage of the fair market value that is determined by local assessors to be the total taxable value of land and additions on the property. | Land | Improvement |
|---|---|---|---|---|
| 2025 | $5,327 | $527,400 | $215,600 | $311,800 |
| 2024 | $5,015 | $488,300 | $205,300 | $283,000 |
| 2023 | $4,776 | $457,000 | $190,100 | $266,900 |
| 2022 | $4,705 | $410,600 | $176,100 | $234,500 |
| 2021 | $4,400 | $374,800 | $176,100 | $198,700 |
| 2020 | $4,166 | $349,500 | $176,100 | $173,400 |
| 2019 | $4,128 | $340,600 | $169,300 | $171,300 |
| 2018 | $4,000 | $320,000 | $161,200 | $158,800 |
| 2017 | $3,906 | $304,900 | $153,600 | $151,300 |
| 2016 | $3,753 | $293,200 | $147,700 | $145,500 |
| 2015 | $3,639 | $282,100 | $147,700 | $134,400 |
| 2014 | $3,421 | $257,200 | $137,400 | $119,800 |
Source: Public Records
Map
Nearby Homes
- 116 Belmont St
- 501 Commerce Dr Unit 2310
- 501 Commerce Dr Unit 1111
- 501 Commerce Dr Unit 4206
- 501 Commerce Dr Unit 4308
- 501 Commerce Dr Unit 4306
- 655 Summer St
- 255 West St
- 262 West St
- 200 Justin Dr Unit 3
- 92 Mercury St
- 432 Grove St
- 441 Grove St
- 972 Liberty St
- 308 Forest St
- 48 Apple Tree Ln
- 67 Abby Rd
- 16 Jay Rd
- 2 Tara Dr Unit 1
- 54 Federal St