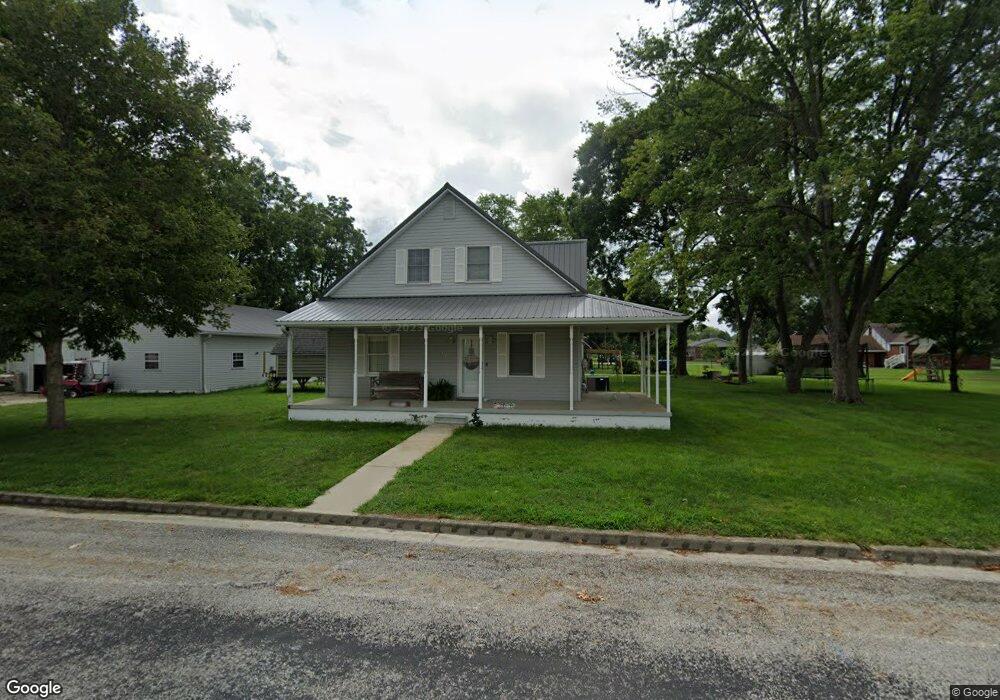
550 W 3rd St Beckemeyer, IL 62219
Estimated Value: $192,000 - $233,000
Studio
--
Bath
2,163
Sq Ft
$96/Sq Ft
Est. Value
About This Home
This home is located at 550 W 3rd St, Beckemeyer, IL 62219 and is currently estimated at $208,666, approximately $96 per square foot. 550 W 3rd St is a home with nearby schools including Breese ESD #12, Beckemeyer Elementary School, and Central Community High School.
Ownership History
Date
Name
Owned For
Owner Type
Purchase Details
Closed on
Jun 8, 2020
Sold by
Ritchey Frederick S and Ritchey Kelly J
Bought by
Hubbard Landyn W
Current Estimated Value
Home Financials for this Owner
Home Financials are based on the most recent Mortgage that was taken out on this home.
Original Mortgage
$145,454
Outstanding Balance
$128,123
Interest Rate
2.87%
Mortgage Type
New Conventional
Estimated Equity
$80,543
Purchase Details
Closed on
Feb 20, 2013
Sold by
Ritchey Fredrick S and Ritchey Kelly J
Bought by
Ritchey Fredrick S and Ritchey Kelly J
Home Financials for this Owner
Home Financials are based on the most recent Mortgage that was taken out on this home.
Original Mortgage
$103,500
Interest Rate
2.62%
Mortgage Type
New Conventional
Create a Home Valuation Report for This Property
The Home Valuation Report is an in-depth analysis detailing your home's value as well as a comparison with similar homes in the area
Purchase History
| Date | Buyer | Sale Price | Title Company |
|---|---|---|---|
| Hubbard Landyn W | $144,000 | None Available | |
| Ritchey Fredrick S | -- | None Available |
Source: Public Records
Mortgage History
| Date | Status | Borrower | Loan Amount |
|---|---|---|---|
| Open | Hubbard Landyn W | $145,454 | |
| Previous Owner | Ritchey Fredrick S | $103,500 |
Source: Public Records
Tax History
| Year | Tax Paid | Tax Assessment Tax Assessment Total Assessment is a certain percentage of the fair market value that is determined by local assessors to be the total taxable value of land and additions on the property. | Land | Improvement |
|---|---|---|---|---|
| 2024 | $3,441 | $57,240 | $11,390 | $45,850 |
| 2023 | $3,441 | $52,030 | $10,350 | $41,680 |
| 2022 | $3,188 | $51,010 | $10,150 | $40,860 |
| 2021 | $3,137 | $50,010 | $9,950 | $40,060 |
| 2020 | $3,134 | $49,020 | $9,750 | $39,270 |
| 2019 | $3,085 | $49,020 | $9,750 | $39,270 |
| 2018 | $3,174 | $47,440 | $8,190 | $39,250 |
| 2017 | $3,208 | $47,440 | $8,190 | $39,250 |
| 2016 | $3,218 | $47,440 | $8,190 | $39,250 |
| 2015 | $2,667 | $47,440 | $8,190 | $39,250 |
| 2013 | $2,667 | $46,890 | $8,190 | $38,700 |
Source: Public Records
Map
Nearby Homes
- 16617 Pembrooke Ct
- 16743 Ashland Ct
- 611 23rd St
- 1910 Franklin St
- 1711 Livingston St
- 0 Redwood St
- 10520 Vonder Haar Ln
- 1491 Clinton St
- 1371 Washington St
- 270 Locust St
- 10675 Buckingham Ct
- 1111 Mulliken St
- 1071 Livingston St
- 951 10th St
- 15207 Business Highway 127
- 9775 Dogwood Dr
- 791 Clinton St
- 730 Jefferson St
- 320 N Oak St
- 1031 N 1st St
Your Personal Tour Guide
Ask me questions while you tour the home.