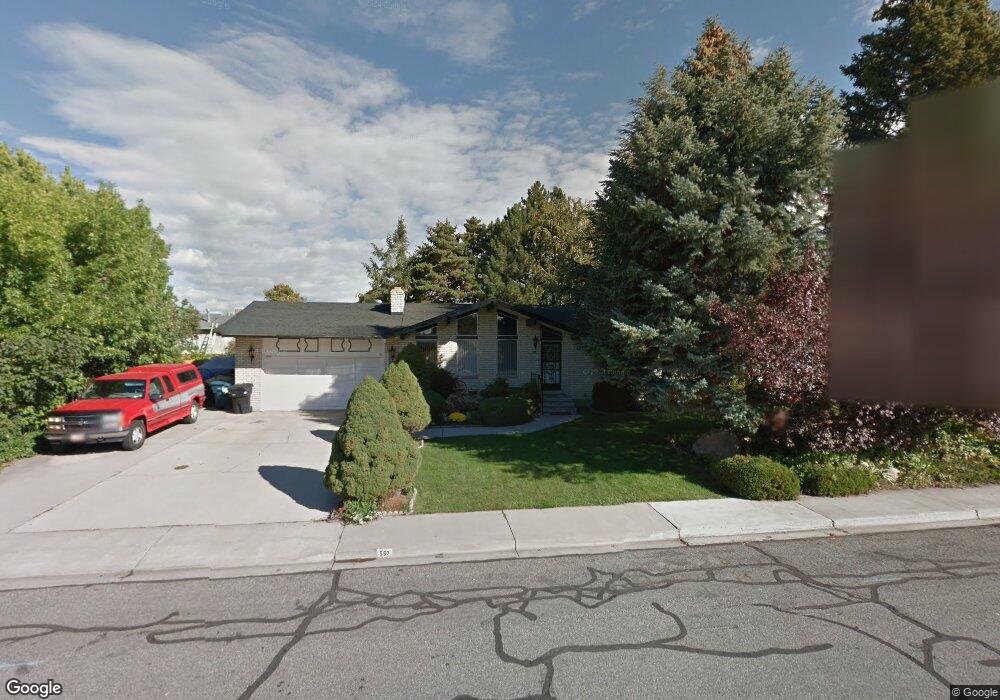
550 W 530 S Orem, UT 84058
Sunset Heights NeighborhoodEstimated Value: $586,000 - $649,000
5
Beds
3
Baths
2,596
Sq Ft
$237/Sq Ft
Est. Value
About This Home
This home is located at 550 W 530 S, Orem, UT 84058 and is currently estimated at $615,487, approximately $237 per square foot. 550 W 530 S is a home located in Utah County with nearby schools including Orem Elementary School, Lakeridge Jr High School, and Mountain View High School.
Ownership History
Date
Name
Owned For
Owner Type
Purchase Details
Closed on
Dec 3, 2021
Sold by
Craigo Leeflang and Craigo Canessa
Bought by
Series Of Dutchscape Llc
Current Estimated Value
Purchase Details
Closed on
Feb 11, 2021
Sold by
Leeflang Bart
Bought by
Leeflang Bartus T and Leeflang Canessa C
Home Financials for this Owner
Home Financials are based on the most recent Mortgage that was taken out on this home.
Original Mortgage
$330,000
Interest Rate
2.65%
Mortgage Type
New Conventional
Purchase Details
Closed on
Apr 4, 2014
Sold by
Jones Jack D
Bought by
Leeflang Bart and Leeflang Canessa
Home Financials for this Owner
Home Financials are based on the most recent Mortgage that was taken out on this home.
Original Mortgage
$169,600
Interest Rate
4.3%
Mortgage Type
New Conventional
Create a Home Valuation Report for This Property
The Home Valuation Report is an in-depth analysis detailing your home's value as well as a comparison with similar homes in the area
Home Values in the Area
Average Home Value in this Area
Purchase History
| Date | Buyer | Sale Price | Title Company |
|---|---|---|---|
| Series Of Dutchscape Llc | -- | Rei Title | |
| Leeflang Bartus T | -- | Trident Title Ins Agency Llc | |
| Leeflang Bart | -- | Trident Title Ins Agency Llc | |
| Leeflang Bart | -- | Provo Land Title Co |
Source: Public Records
Mortgage History
| Date | Status | Borrower | Loan Amount |
|---|---|---|---|
| Previous Owner | Leeflang Bart | $330,000 | |
| Previous Owner | Leeflang Bart | $169,600 |
Source: Public Records
Tax History
| Year | Tax Paid | Tax Assessment Tax Assessment Total Assessment is a certain percentage of the fair market value that is determined by local assessors to be the total taxable value of land and additions on the property. | Land | Improvement |
|---|---|---|---|---|
| 2025 | $2,293 | $321,090 | -- | -- |
| 2024 | $2,293 | $280,445 | $0 | $0 |
| 2023 | $2,054 | $269,940 | $0 | $0 |
| 2022 | $2,007 | $255,585 | $0 | $0 |
| 2021 | $1,868 | $360,300 | $178,100 | $182,200 |
| 2020 | $1,694 | $321,100 | $142,500 | $178,600 |
| 2019 | $1,546 | $304,800 | $131,500 | $173,300 |
| 2018 | $1,467 | $276,300 | $113,200 | $163,100 |
| 2017 | $1,336 | $134,750 | $0 | $0 |
| 2016 | $1,344 | $125,015 | $0 | $0 |
| 2015 | $1,298 | $114,180 | $0 | $0 |
| 2014 | $1,272 | $111,375 | $0 | $0 |
Source: Public Records
Map
Nearby Homes
Your Personal Tour Guide
Ask me questions while you tour the home.