Estimated Value: $397,329 - $527,000
2
Beds
1
Bath
1,009
Sq Ft
$439/Sq Ft
Est. Value
About This Home
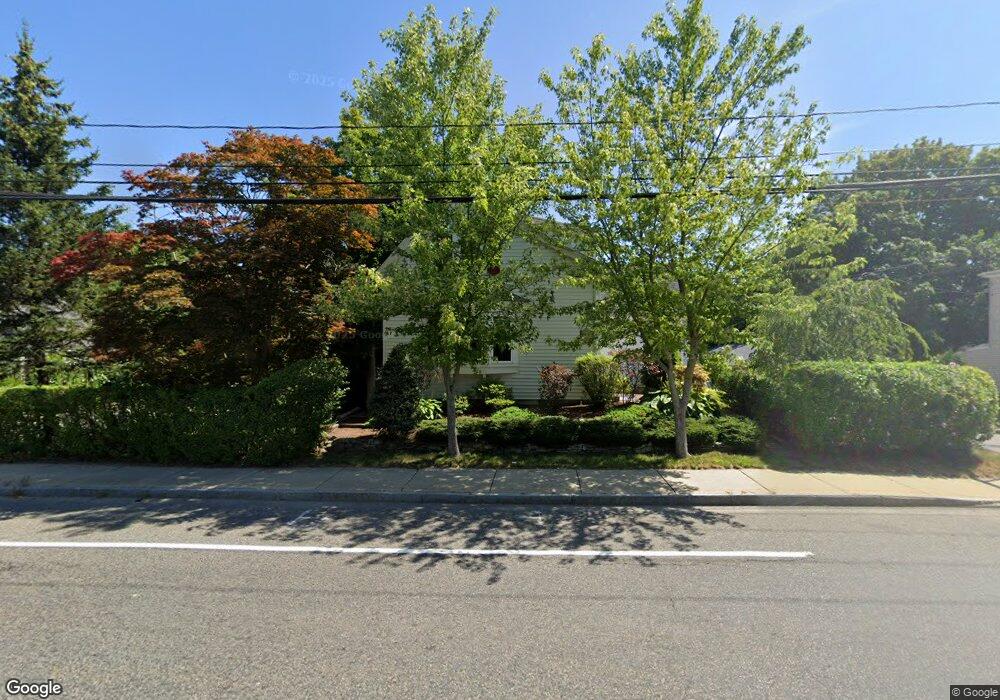
This home is located at 550 W Main St, Avon, MA 02322 and is currently estimated at $443,332, approximately $439 per square foot. 550 W Main St is a home located in Norfolk County with nearby schools including Ralph D. Butler Elementary School and Avon Middle/High School.
Ownership History
Date
Name
Owned For
Owner Type
Purchase Details
Closed on
Jan 17, 2025
Sold by
Sawler Michael S and Sawler Deborah A
Bought by
Five Star Irt and Sawler
Current Estimated Value
Purchase Details
Closed on
May 9, 2008
Sold by
Sawler Albert and Sawler Elaine
Bought by
Sawler Deborah A and Sawler Michael S
Home Financials for this Owner
Home Financials are based on the most recent Mortgage that was taken out on this home.
Original Mortgage
$185,000
Interest Rate
5.93%
Mortgage Type
Purchase Money Mortgage
Create a Home Valuation Report for This Property
The Home Valuation Report is an in-depth analysis detailing your home's value as well as a comparison with similar homes in the area
Home Values in the Area
Average Home Value in this Area
Purchase History
| Date | Buyer | Sale Price | Title Company |
|---|---|---|---|
| Five Star Irt | -- | None Available | |
| Sawler Deborah A | $125,000 | -- | |
| Sawler Deborah A | $125,000 | -- | |
| Sawler Deborah A | $125,000 | -- |
Source: Public Records
Mortgage History
| Date | Status | Borrower | Loan Amount |
|---|---|---|---|
| Previous Owner | Sawler Deborah A | $185,000 |
Source: Public Records
Tax History
| Year | Tax Paid | Tax Assessment Tax Assessment Total Assessment is a certain percentage of the fair market value that is determined by local assessors to be the total taxable value of land and additions on the property. | Land | Improvement |
|---|---|---|---|---|
| 2025 | $41 | $305,600 | $153,400 | $152,200 |
| 2024 | $3,767 | $268,500 | $137,800 | $130,700 |
| 2023 | $3,657 | $268,500 | $137,800 | $130,700 |
| 2022 | $3,647 | $230,700 | $114,800 | $115,900 |
| 2021 | $3,445 | $205,300 | $104,200 | $101,100 |
| 2020 | $3,830 | $216,400 | $93,000 | $123,400 |
| 2019 | $3,521 | $195,700 | $85,100 | $110,600 |
| 2018 | $3,630 | $195,700 | $85,100 | $110,600 |
| 2017 | $3,107 | $179,800 | $85,100 | $94,700 |
| 2016 | $3,155 | $184,400 | $87,700 | $96,700 |
| 2015 | $2,829 | $172,800 | $87,700 | $85,100 |
Source: Public Records
Map
Nearby Homes
Your Personal Tour Guide
Ask me questions while you tour the home.