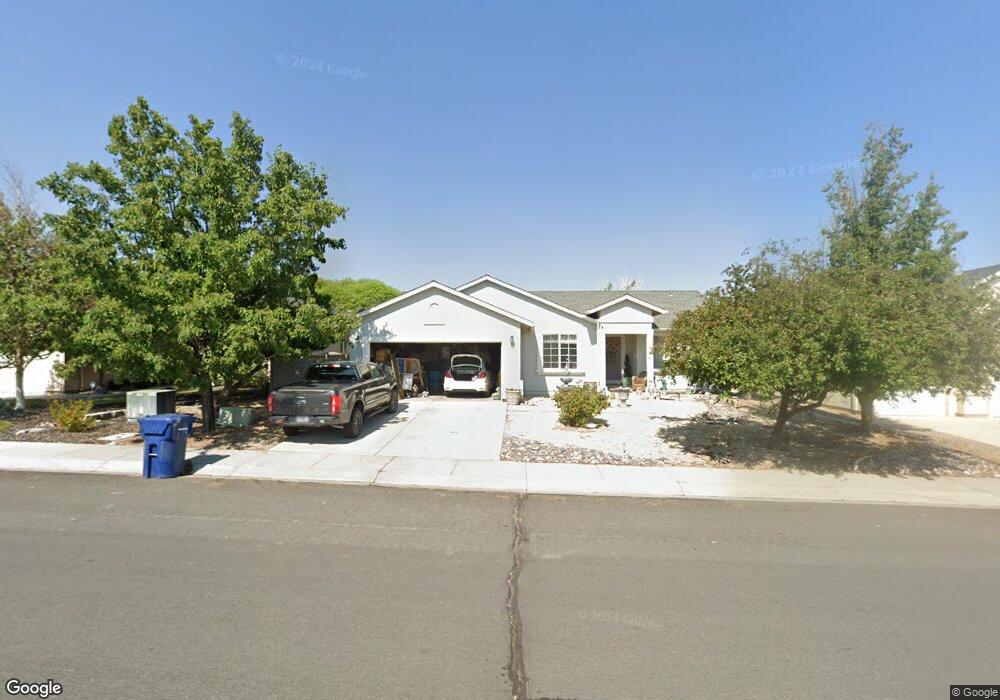
550 Wedge Ln Fernley, NV 89408
Estimated Value: $374,552 - $409,000
3
Beds
2
Baths
1,546
Sq Ft
$250/Sq Ft
Est. Value
About This Home
This home is located at 550 Wedge Ln, Fernley, NV 89408 and is currently estimated at $386,138, approximately $249 per square foot. 550 Wedge Ln is a home located in Lyon County with nearby schools including East Valley Elementary School, Fernley Intermediate School, and Fernley High School.
Ownership History
Date
Name
Owned For
Owner Type
Purchase Details
Closed on
Sep 11, 2024
Sold by
Burgess Tony
Bought by
Burgess Tony and Burgess Sherril L
Current Estimated Value
Purchase Details
Closed on
Dec 17, 2020
Sold by
Ford Carol L and Ford Olan D
Bought by
Burgess Tony
Purchase Details
Closed on
Dec 20, 2011
Sold by
Devine Ronald and Devine Sheila
Bought by
Ford Olan
Home Financials for this Owner
Home Financials are based on the most recent Mortgage that was taken out on this home.
Original Mortgage
$81,850
Interest Rate
3.93%
Mortgage Type
New Conventional
Purchase Details
Closed on
Dec 17, 2011
Sold by
Ford Carol
Bought by
Ford Olan
Home Financials for this Owner
Home Financials are based on the most recent Mortgage that was taken out on this home.
Original Mortgage
$81,850
Interest Rate
3.93%
Mortgage Type
New Conventional
Create a Home Valuation Report for This Property
The Home Valuation Report is an in-depth analysis detailing your home's value as well as a comparison with similar homes in the area
Home Values in the Area
Average Home Value in this Area
Purchase History
| Date | Buyer | Sale Price | Title Company |
|---|---|---|---|
| Burgess Tony | -- | None Listed On Document | |
| Burgess Tony | -- | None Available | |
| Ford Olan | $91,000 | Ticor Title Reno Lakeside | |
| Ford Olan | -- | Ticor Title Of Nevada Inc |
Source: Public Records
Mortgage History
| Date | Status | Borrower | Loan Amount |
|---|---|---|---|
| Previous Owner | Ford Olan | $81,850 |
Source: Public Records
Tax History Compared to Growth
Tax History
| Year | Tax Paid | Tax Assessment Tax Assessment Total Assessment is a certain percentage of the fair market value that is determined by local assessors to be the total taxable value of land and additions on the property. | Land | Improvement |
|---|---|---|---|---|
| 2025 | $1,912 | $106,891 | $47,250 | $59,641 |
| 2024 | $2,266 | $107,398 | $47,250 | $60,147 |
| 2023 | $2,266 | $103,596 | $47,250 | $56,346 |
| 2022 | $2,134 | $99,366 | $47,250 | $52,116 |
| 2021 | $2,109 | $92,923 | $42,000 | $50,923 |
| 2020 | $1,980 | $90,847 | $42,000 | $48,847 |
| 2019 | $1,899 | $74,808 | $28,000 | $46,808 |
| 2018 | $1,833 | $67,130 | $21,350 | $45,780 |
| 2017 | $1,809 | $58,094 | $12,250 | $45,844 |
| 2016 | $1,619 | $49,292 | $5,250 | $44,042 |
| 2015 | $1,653 | $41,490 | $5,250 | $36,240 |
| 2014 | $1,614 | $33,400 | $5,250 | $28,150 |
Source: Public Records
Map
Nearby Homes
- 1905 Seven Iron Ct
- 322 Bens Way
- 326 Bens Way
- 610 Wedge Ln
- 4255 E Highway 50a
- 1610 Mary Ct
- 203 Mary Lou Ln
- 240 Mary Lou Ln
- 239 Mary Lou Ln
- 288 Fallen Leaf Ln
- 1129 Dixie Ln
- 1498 Slice Cir
- 1103 Dixie Ln
- 1304 Serenity Cir Unit LOT 24
- 4505 Farm District Rd
- 1310 Serenity Cir Unit LOT 21
- 231 Amber Ct
- 777 Divot Dr
- 770 Divot Dr
- 231 Poppy Hills Dr