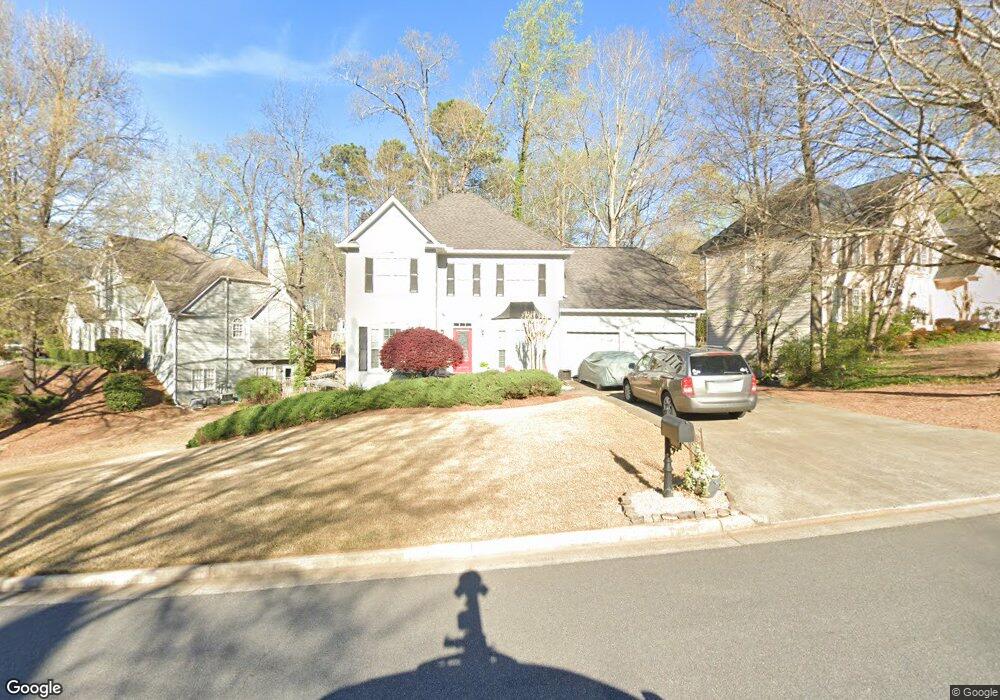
5500 Ashewoode Downs Dr Unit 1 Alpharetta, GA 30005
Windward NeighborhoodEstimated Value: $573,000 - $728,000
4
Beds
3
Baths
2,073
Sq Ft
$297/Sq Ft
Est. Value
About This Home
This home is located at 5500 Ashewoode Downs Dr Unit 1, Alpharetta, GA 30005 and is currently estimated at $616,304, approximately $297 per square foot. 5500 Ashewoode Downs Dr Unit 1 is a home located in Fulton County with nearby schools including Lake Windward Elementary School, Taylor Road Middle School, and Chattahoochee High School.
Ownership History
Date
Name
Owned For
Owner Type
Purchase Details
Closed on
Aug 31, 2005
Sold by
Manning Thomas N
Bought by
Manning Thomas N and Manning Catherine A
Current Estimated Value
Home Financials for this Owner
Home Financials are based on the most recent Mortgage that was taken out on this home.
Original Mortgage
$245,200
Outstanding Balance
$129,447
Interest Rate
5.64%
Mortgage Type
New Conventional
Estimated Equity
$486,857
Purchase Details
Closed on
Dec 7, 2001
Sold by
Holmes Stephen T
Bought by
Holmes Stephen T
Home Financials for this Owner
Home Financials are based on the most recent Mortgage that was taken out on this home.
Original Mortgage
$48,350
Interest Rate
6.42%
Mortgage Type
New Conventional
Purchase Details
Closed on
Jun 27, 1997
Sold by
Ralph Randal W and Ralph Catherine
Bought by
White Rollie H and White Kathleen
Home Financials for this Owner
Home Financials are based on the most recent Mortgage that was taken out on this home.
Original Mortgage
$149,200
Interest Rate
7.5%
Mortgage Type
New Conventional
Create a Home Valuation Report for This Property
The Home Valuation Report is an in-depth analysis detailing your home's value as well as a comparison with similar homes in the area
Home Values in the Area
Average Home Value in this Area
Purchase History
| Date | Buyer | Sale Price | Title Company |
|---|---|---|---|
| Manning Thomas N | -- | -- | |
| Manning Thomas N | $306,500 | -- | |
| Holmes Stephen T | -- | -- | |
| White Rollie H | $186,500 | -- |
Source: Public Records
Mortgage History
| Date | Status | Borrower | Loan Amount |
|---|---|---|---|
| Open | Manning Thomas N | $245,200 | |
| Previous Owner | Holmes Stephen T | $48,350 | |
| Previous Owner | White Rollie H | $149,200 |
Source: Public Records
Tax History Compared to Growth
Tax History
| Year | Tax Paid | Tax Assessment Tax Assessment Total Assessment is a certain percentage of the fair market value that is determined by local assessors to be the total taxable value of land and additions on the property. | Land | Improvement |
|---|---|---|---|---|
| 2025 | $3,131 | $185,880 | $53,360 | $132,520 |
| 2023 | $5,072 | $179,680 | $50,400 | $129,280 |
| 2022 | $3,005 | $164,240 | $43,120 | $121,120 |
| 2021 | $2,958 | $121,200 | $30,000 | $91,200 |
| 2020 | $2,970 | $108,160 | $14,520 | $93,640 |
| 2019 | $347 | $106,280 | $14,280 | $92,000 |
| 2018 | $2,976 | $103,760 | $13,920 | $89,840 |
| 2017 | $2,881 | $96,800 | $32,200 | $64,600 |
| 2016 | $2,831 | $96,800 | $32,200 | $64,600 |
| 2015 | $2,862 | $96,800 | $32,200 | $64,600 |
| 2014 | $2,583 | $86,280 | $28,680 | $57,600 |
Source: Public Records
Map
Nearby Homes
- 5440 Vicarage Walk
- 12470 Concord Hall Dr
- 640 Evening Pine Ln
- 5650 Preserve Cir
- 680 Evening Pine Ln
- 5635 Ashewoode Downs Dr
- 5455 Woodrun Ln
- 5510 Vicarage Walk
- 5735 Sunset Maple Dr
- 140 Ashewoode Downs Ln
- 12205 Stevens Creek Dr
- 12595 Huntington Trace
- 5370 McGinnis Ferry Rd
- 11835 Leeward Walk Cir
- 110 W Meadows Ct
- 2485 Hamptons Passage
- 5490 Ashewoode Downs Dr
- 5510 Ashewoode Downs Dr
- 5475 Ashewoode Downs Dr
- 215 Ashebourne Trail
- 215 Ashebourne Trail
- 5480 Ashewoode Downs Dr
- 5465 Ashewoode Downs Dr
- 225 Ashebourne Trail
- 400 Eastbourne Way
- 5470 Ashewoode Downs Dr Unit 2
- 105 Mirrowood Ln
- 5495 Ashewoode Downs Dr
- 5520 Ashebourne Trail
- 235 Ashebourne Trail
- 200 Mirrowood Dr
- 5505 Ashewoode Downs Dr
- 0 Ashebourne Trail Unit 7305725
- 0 Ashebourne Trail
- 5515 Ashewoode Downs Dr
- 115 Mirrowood Ln Unit 1