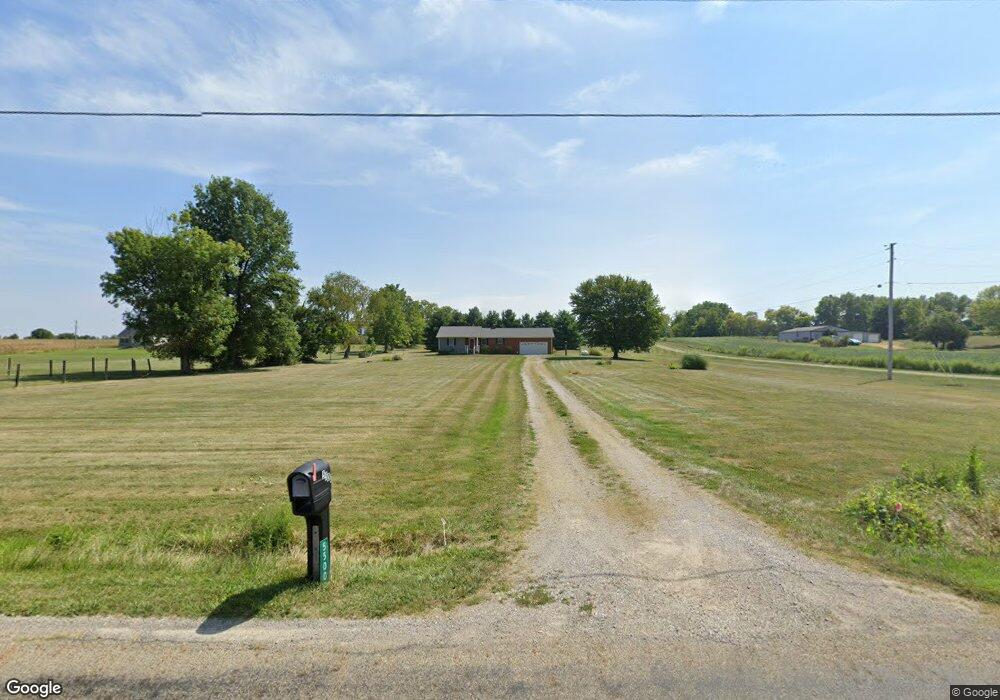
5500 Election House Rd Carroll, OH 43112
Estimated Value: $362,000 - $400,000
3
Beds
2
Baths
1,440
Sq Ft
$266/Sq Ft
Est. Value
About This Home
This home is located at 5500 Election House Rd, Carroll, OH 43112 and is currently estimated at $383,749, approximately $266 per square foot. 5500 Election House Rd is a home located in Fairfield County with nearby schools including Bloom Carroll Primary School, Bloom Carroll Intermediate School, and Bloom-Carroll Middle School.
Ownership History
Date
Name
Owned For
Owner Type
Purchase Details
Closed on
Mar 12, 2018
Sold by
Sponseller John P and Sponseller Susan K
Bought by
Sponseller Andrew J and The Sponseller Family Trust
Current Estimated Value
Purchase Details
Closed on
Mar 26, 2012
Sold by
Rager Brent A
Bought by
Sponseller John P and Sponseller Susan K
Home Financials for this Owner
Home Financials are based on the most recent Mortgage that was taken out on this home.
Original Mortgage
$108,000
Outstanding Balance
$74,491
Interest Rate
3.88%
Mortgage Type
New Conventional
Estimated Equity
$309,258
Purchase Details
Closed on
Mar 25, 2009
Sold by
Riggs Donald K and Riggs Melinda L
Bought by
Rager Brent A
Home Financials for this Owner
Home Financials are based on the most recent Mortgage that was taken out on this home.
Original Mortgage
$148,117
Interest Rate
5.22%
Mortgage Type
VA
Purchase Details
Closed on
May 1, 1989
Bought by
Riggs Donald K
Create a Home Valuation Report for This Property
The Home Valuation Report is an in-depth analysis detailing your home's value as well as a comparison with similar homes in the area
Home Values in the Area
Average Home Value in this Area
Purchase History
| Date | Buyer | Sale Price | Title Company |
|---|---|---|---|
| Sponseller Andrew J | -- | None Available | |
| Sponseller John P | $160,000 | Valmer Land Title Agency | |
| Rager Brent A | $145,000 | Valmer Land Title Agency | |
| Riggs Donald K | $12,800 | -- |
Source: Public Records
Mortgage History
| Date | Status | Borrower | Loan Amount |
|---|---|---|---|
| Open | Sponseller John P | $108,000 | |
| Closed | Rager Brent A | $148,117 |
Source: Public Records
Tax History Compared to Growth
Tax History
| Year | Tax Paid | Tax Assessment Tax Assessment Total Assessment is a certain percentage of the fair market value that is determined by local assessors to be the total taxable value of land and additions on the property. | Land | Improvement |
|---|---|---|---|---|
| 2024 | $7,628 | $94,520 | $25,240 | $69,280 |
| 2023 | $4,211 | $94,520 | $25,240 | $69,280 |
| 2022 | $4,241 | $94,520 | $25,240 | $69,280 |
| 2021 | $3,290 | $71,840 | $21,040 | $50,800 |
| 2020 | $3,329 | $71,840 | $21,040 | $50,800 |
| 2019 | $3,343 | $71,840 | $21,040 | $50,800 |
| 2018 | $2,523 | $52,310 | $16,830 | $35,480 |
| 2017 | $2,371 | $55,610 | $16,830 | $38,780 |
| 2016 | $2,302 | $55,610 | $16,830 | $38,780 |
| 2015 | $2,216 | $52,120 | $16,830 | $35,290 |
| 2014 | $2,120 | $52,120 | $16,830 | $35,290 |
| 2013 | $2,120 | $52,120 | $16,830 | $35,290 |
Source: Public Records
Map
Nearby Homes
- 2831 Sterling Dr NW
- 0 Brook Rd NW
- 5870 Brook Rd NW
- 5095 Lancaster Kirkersville Rd NW
- 6990 Bader Rd NW
- 4656 Meadow Grove Dr NW
- 4345 Lancaster Kirkersville Rd NW
- 1705 Ginder Rd NW
- 3515 Election House Rd NW
- 1502 Leonard Rd NW
- 1350 Leonard Rd NW
- 133 N Creekview Ct
- 4077 Basil Western Rd NW
- 0 S Company St Unit Lot 2 225029545
- 0 S Company St Unit Lot 1 225029543
- 1080 Coonpath Rd NW
- 111 N High St
- 5804 Feldon Ct NW
- 5842 Feldon Ct NW
- 1025 W Kumler St
- 5500 Election House Rd
- 5484 Election House Rd
- 5530 Election House Rd
- 5535 Election House Rd
- 5480 Election House Rd
- 5481 Election House Rd
- 5454 Election House Rd
- 5414 Election House Rd
- 5627 Election House Rd
- 5386 Election House Rd
- 5490 Election House Rd
- 5300 Election House Rd
- 2830 Sterling Dr
- 5790 Election House Rd
- 5790 Election House Rd
- 5780 Election House Rd
- 2831 Sterling Dr
- 5136 Election House Rd
- 2840 Sterling Dr
- 5826 Election House Rd