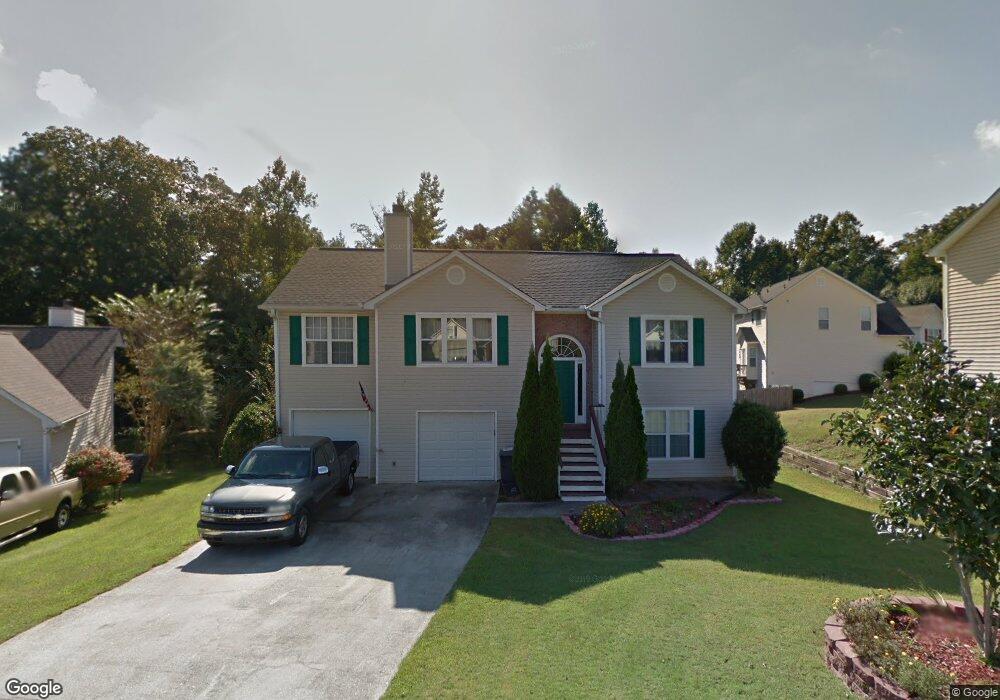
5500 Sugar Crossing Dr Buford, GA 30518
Estimated Value: $377,000 - $419,000
4
Beds
3
Baths
2,105
Sq Ft
$188/Sq Ft
Est. Value
About This Home
This home is located at 5500 Sugar Crossing Dr, Buford, GA 30518 and is currently estimated at $394,993, approximately $187 per square foot. 5500 Sugar Crossing Dr is a home located in Gwinnett County with nearby schools including Sycamore Elementary School, Lanier Middle School, and Lanier High School.
Ownership History
Date
Name
Owned For
Owner Type
Purchase Details
Closed on
Sep 8, 2010
Sold by
Federal Natl Mtg Assn Fnma
Bought by
Rogers Thomas E
Current Estimated Value
Home Financials for this Owner
Home Financials are based on the most recent Mortgage that was taken out on this home.
Original Mortgage
$63,000
Outstanding Balance
$41,274
Interest Rate
4.44%
Mortgage Type
New Conventional
Estimated Equity
$353,719
Purchase Details
Closed on
May 4, 2010
Sold by
Wells Fargo Bk Na
Bought by
Federal Natl Mtg Assn Fnma
Purchase Details
Closed on
Sep 30, 2004
Sold by
Schlief Richard G and Schlief Stacey
Bought by
Torres Edith R
Home Financials for this Owner
Home Financials are based on the most recent Mortgage that was taken out on this home.
Original Mortgage
$165,000
Interest Rate
5.73%
Mortgage Type
New Conventional
Purchase Details
Closed on
Jan 6, 2000
Sold by
Jackson Karen S
Bought by
Schlief Richard G and Schlief Stacey D
Home Financials for this Owner
Home Financials are based on the most recent Mortgage that was taken out on this home.
Original Mortgage
$117,000
Interest Rate
7.8%
Mortgage Type
New Conventional
Purchase Details
Closed on
Apr 1, 1997
Sold by
Richland Communities Inc
Bought by
Jackson Karen S
Create a Home Valuation Report for This Property
The Home Valuation Report is an in-depth analysis detailing your home's value as well as a comparison with similar homes in the area
Home Values in the Area
Average Home Value in this Area
Purchase History
| Date | Buyer | Sale Price | Title Company |
|---|---|---|---|
| Rogers Thomas E | $120,000 | -- | |
| Federal Natl Mtg Assn Fnma | -- | -- | |
| Wells Fargo Bk Na | $167,580 | -- | |
| Torres Edith R | $165,000 | -- | |
| Schlief Richard G | $130,000 | -- | |
| Jackson Karen S | $116,500 | -- |
Source: Public Records
Mortgage History
| Date | Status | Borrower | Loan Amount |
|---|---|---|---|
| Open | Rogers Thomas E | $63,000 | |
| Previous Owner | Torres Edith R | $165,000 | |
| Previous Owner | Schlief Richard G | $117,000 | |
| Closed | Jackson Karen S | $0 |
Source: Public Records
Tax History Compared to Growth
Tax History
| Year | Tax Paid | Tax Assessment Tax Assessment Total Assessment is a certain percentage of the fair market value that is determined by local assessors to be the total taxable value of land and additions on the property. | Land | Improvement |
|---|---|---|---|---|
| 2025 | $551 | $167,040 | $34,000 | $133,040 |
| 2024 | $748 | $159,880 | $28,800 | $131,080 |
| 2023 | $748 | $148,440 | $26,000 | $122,440 |
| 2022 | $748 | $141,080 | $22,000 | $119,080 |
| 2021 | $748 | $99,840 | $14,400 | $85,440 |
| 2020 | $1,148 | $99,840 | $14,400 | $85,440 |
| 2019 | $1,040 | $90,440 | $14,400 | $76,040 |
| 2018 | $1,005 | $81,240 | $12,000 | $69,240 |
| 2016 | $937 | $64,640 | $12,000 | $52,640 |
| 2015 | $922 | $60,440 | $11,600 | $48,840 |
| 2014 | $931 | $60,440 | $11,600 | $48,840 |
Source: Public Records
Map
Nearby Homes
- 978 Sugar Vista Cir
- 965 Sugar Meadow Dr
- 5605 Austin Garner Rd
- 1025 Hunters Oak Trail
- 5557 Pinedale Cir
- 5650 Princeton Oaks Dr
- 1114 Danube Trail
- 5680 Princeton Oaks Dr
- 1150 Sycamore Creek Trail
- 818 Pond View Ct
- 5671 Arbor Green Cir
- 965 Garner Spring Ln
- 5840 Stephens Mill Dr
- 915 Riverside Rd Unit 3
- 5730 Arbor Green Cir
- 1181 Chastain Dr
- The Ellison II Plan at Ellison Square
- 5490 Sugar Crossing Dr Unit 4
- 963 Sugar Landing Cir
- 5510 Sugar Crossing Dr Unit 4
- 5480 Sugar Crossing Dr
- 958 Sugar Landing Cir
- 958 Sugar Landing Cir Unit 4
- 5485 Sugar Crossing Dr
- 0 Sugar Landing Cir Unit 7192539
- 5505 Sugar Crossing Dr
- 968 Sugar Landing Cir
- 5515 Sugar Crossing Dr
- 5495 Sugar Crossing Dr
- 5495 Sugar Crossing Dr
- 5525 Sugar Crossing Dr Unit 4
- 5575 Austin Garner Rd
- 988 Sugar Landing Cir
- 5555 Austin Garner Rd
- 5535 Sugar Crossing Dr
- 5585 Austin Garner Rd
- 978 Sugar Landing Cir Unit 57