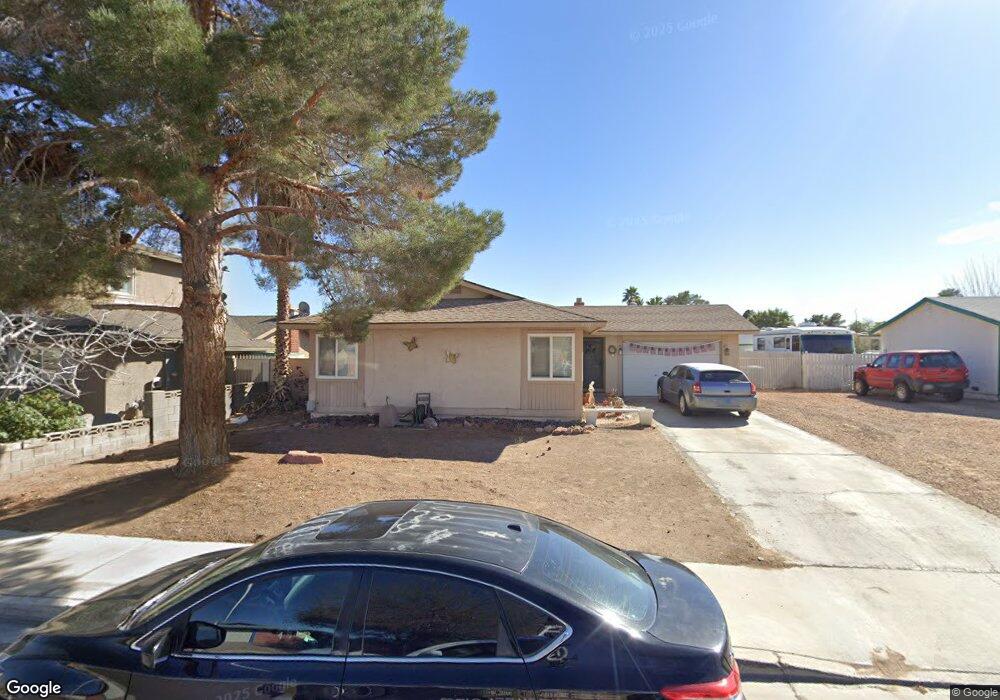
5501 Mossman Ave Las Vegas, NV 89108
Michael Way NeighborhoodEstimated Value: $345,012 - $423,000
3
Beds
2
Baths
1,096
Sq Ft
$344/Sq Ft
Est. Value
About This Home
This home is located at 5501 Mossman Ave, Las Vegas, NV 89108 and is currently estimated at $376,503, approximately $343 per square foot. 5501 Mossman Ave is a home located in Clark County with nearby schools including Doris M. Reed Elementary School, Irwin & Susan Molasky Junior High School, and Cimarron Memorial High School.
Ownership History
Date
Name
Owned For
Owner Type
Purchase Details
Closed on
Dec 23, 2004
Sold by
Veilleux Russell and Veilleux Mary
Bought by
Veilleux Mary
Current Estimated Value
Home Financials for this Owner
Home Financials are based on the most recent Mortgage that was taken out on this home.
Original Mortgage
$155,200
Outstanding Balance
$77,776
Interest Rate
5.74%
Mortgage Type
New Conventional
Estimated Equity
$298,727
Purchase Details
Closed on
Jun 29, 2000
Sold by
Scruton Stacey B
Bought by
Veilleux Russell and Veilleux Mary
Home Financials for this Owner
Home Financials are based on the most recent Mortgage that was taken out on this home.
Original Mortgage
$103,020
Interest Rate
8.37%
Purchase Details
Closed on
Dec 9, 1993
Sold by
Schalip Michael Andrew and Schalip Darcie D
Bought by
Scruton Stacey B
Home Financials for this Owner
Home Financials are based on the most recent Mortgage that was taken out on this home.
Original Mortgage
$84,763
Interest Rate
7.2%
Mortgage Type
FHA
Create a Home Valuation Report for This Property
The Home Valuation Report is an in-depth analysis detailing your home's value as well as a comparison with similar homes in the area
Home Values in the Area
Average Home Value in this Area
Purchase History
| Date | Buyer | Sale Price | Title Company |
|---|---|---|---|
| Veilleux Mary | -- | Fidelity National Title | |
| Veilleux Russell | $101,000 | Fidelity National Title | |
| Scruton Stacey B | $85,000 | Land Title |
Source: Public Records
Mortgage History
| Date | Status | Borrower | Loan Amount |
|---|---|---|---|
| Open | Veilleux Mary | $155,200 | |
| Closed | Veilleux Russell | $103,020 | |
| Previous Owner | Scruton Stacey B | $84,763 |
Source: Public Records
Tax History Compared to Growth
Tax History
| Year | Tax Paid | Tax Assessment Tax Assessment Total Assessment is a certain percentage of the fair market value that is determined by local assessors to be the total taxable value of land and additions on the property. | Land | Improvement |
|---|---|---|---|---|
| 2025 | $741 | $50,155 | $28,700 | $21,455 |
| 2024 | $720 | $50,155 | $28,700 | $21,455 |
| 2023 | $587 | $53,109 | $31,850 | $21,259 |
| 2022 | $699 | $42,464 | $22,750 | $19,714 |
| 2021 | $679 | $38,368 | $19,250 | $19,118 |
| 2020 | $656 | $37,846 | $18,550 | $19,296 |
| 2019 | $637 | $35,054 | $15,750 | $19,304 |
| 2018 | $618 | $33,845 | $15,050 | $18,795 |
| 2017 | $999 | $30,470 | $11,200 | $19,270 |
| 2016 | $587 | $27,912 | $8,050 | $19,862 |
| 2015 | $584 | $25,681 | $7,000 | $18,681 |
| 2014 | $567 | $22,668 | $5,250 | $17,418 |
Source: Public Records
Map
Nearby Homes
- 5500 Avenida Vaquero
- 2913 N Michael Way
- 5325 Redberry St
- 2829 N Michael Way
- 5305 W Cheyenne Ave
- 3217 Joann Way
- 5710 Madre Mesa Dr
- 5905 Paseo Montana
- 0 W Cheyenne Ave
- 5486 Alfred Dr
- 5807 Madre Mesa Dr
- 2879 N Jones Blvd
- 5854 Alfred Dr
- 6100 W Brooks Ave
- 5113 Mambo Vista Ave
- 5537 Cleary Ct
- 5828 Divers Cove Way
- 5901 Oceanside Way
- 2601 La Mata St
- 5401 Bugle Way Unit 103
- 5505 Mossman Ave
- 5421 Mossman Ave
- 5509 Mossman Ave
- 5417 Mossman Ave
- 5500 Mossman Ave
- 5420 Mossman Ave
- 5508 Avenida Vaquero
- 5504 Avenida Vaquero
- 5504 Mossman Ave
- 5416 Mossman Ave
- 5512 Avenida Vaquero
- 5513 Mossman Ave
- 5413 Mossman Ave
- 5508 Mossman Ave
- 5412 Mossman Ave
- 5421 Burntwood Way
- 5501 Burntwood Way
- 5409 Mossman Ave
- 5601 Mossman Ave
- 5417 Burntwood Way