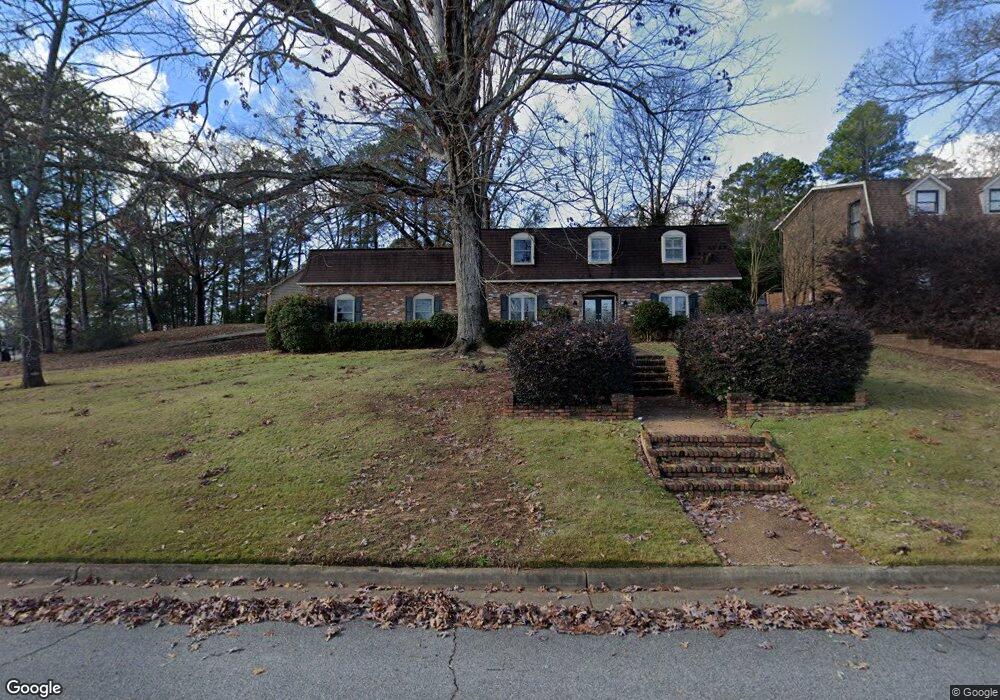
5501 Roaring Branch Rd Columbus, GA 31904
North Columbus NeighborhoodEstimated Value: $318,000 - $435,000
4
Beds
3
Baths
2,568
Sq Ft
$152/Sq Ft
Est. Value
About This Home
This home is located at 5501 Roaring Branch Rd, Columbus, GA 31904 and is currently estimated at $390,418, approximately $152 per square foot. 5501 Roaring Branch Rd is a home located in Muscogee County with nearby schools including River Road Elementary School, Double Churches Middle School, and Northside High School.
Ownership History
Date
Name
Owned For
Owner Type
Purchase Details
Closed on
Aug 25, 2020
Sold by
Pignato Carlos Vito
Bought by
Turner Derek Ross and Turner Courtney
Current Estimated Value
Home Financials for this Owner
Home Financials are based on the most recent Mortgage that was taken out on this home.
Original Mortgage
$286,440
Outstanding Balance
$254,197
Interest Rate
2.9%
Mortgage Type
VA
Estimated Equity
$136,221
Purchase Details
Closed on
May 25, 2016
Sold by
Pignato Marian Edith
Bought by
Pignato Carlos Vito
Purchase Details
Closed on
Sep 18, 2014
Sold by
Pignato V Carlos
Bought by
Pignato V Carlos and Pignato Marian Edith
Purchase Details
Closed on
Aug 30, 2007
Sold by
Reynolds Patricia L
Bought by
Pignato Carlos
Home Financials for this Owner
Home Financials are based on the most recent Mortgage that was taken out on this home.
Original Mortgage
$38,985
Interest Rate
6.62%
Mortgage Type
Stand Alone Second
Create a Home Valuation Report for This Property
The Home Valuation Report is an in-depth analysis detailing your home's value as well as a comparison with similar homes in the area
Home Values in the Area
Average Home Value in this Area
Purchase History
| Date | Buyer | Sale Price | Title Company |
|---|---|---|---|
| Turner Derek Ross | $280,000 | -- | |
| Pignato Carlos Vito | -- | -- | |
| Pignato V Carlos | -- | -- | |
| Pignato Carlos | $259,900 | None Available |
Source: Public Records
Mortgage History
| Date | Status | Borrower | Loan Amount |
|---|---|---|---|
| Open | Turner Derek Ross | $286,440 | |
| Previous Owner | Pignato Carlos | $38,985 | |
| Previous Owner | Pignato Carlos | $207,920 |
Source: Public Records
Tax History
| Year | Tax Paid | Tax Assessment Tax Assessment Total Assessment is a certain percentage of the fair market value that is determined by local assessors to be the total taxable value of land and additions on the property. | Land | Improvement |
|---|---|---|---|---|
| 2025 | $5,500 | $140,500 | $28,576 | $111,924 |
| 2024 | $5,500 | $140,500 | $28,576 | $111,924 |
| 2023 | $5,534 | $140,500 | $28,576 | $111,924 |
| 2022 | $4,819 | $118,024 | $28,576 | $89,448 |
| 2021 | $4,561 | $111,700 | $28,576 | $83,124 |
| 2020 | $4,135 | $101,244 | $28,576 | $72,668 |
| 2019 | $4,148 | $101,244 | $28,576 | $72,668 |
| 2018 | $4,148 | $101,244 | $28,576 | $72,668 |
| 2017 | $4,161 | $101,244 | $28,576 | $72,668 |
| 2016 | $4,273 | $103,592 | $8,157 | $95,435 |
| 2015 | $4,278 | $103,592 | $8,157 | $95,435 |
| 2014 | $4,284 | $103,592 | $8,157 | $95,435 |
| 2013 | -- | $103,592 | $8,157 | $95,435 |
Source: Public Records
Map
Nearby Homes
- 5472 Roaring Branch Rd
- 5431 Roaring Branch Rd
- 222 Cascade Rd
- 254 Cascade Rd
- 306 Cascade Rd
- 258 Cascade Rd
- 217 Moss Dr
- 6101 River Rd Unit 14
- 6101 River Rd Unit 13
- 6101 River Rd Unit 2
- 803 Litchfield Rd
- 804 Lichfield Rd
- 407 Grey Moss Cove
- 831 53rd St
- 411 49th St
- 212 47th St
- 801 50th St
- 6400 Green Island Dr Unit 42
- 6400 Green Island Dr Unit 11
- 6400 Green Island Dr Unit 43
- 5515 Roaring Branch Rd
- 5511 Roaring Branch Rd
- 5457 Roaring Branch Rd
- 2 Stonehaven Ct
- 3 Stonehaven Ct
- 5500 Roaring Branch Rd
- 5519 Roaring Branch Rd
- 5462 Roaring Branch Rd
- 1 Stonehaven Ct
- 5512 Roaring Branch Rd
- 5452 Roaring Branch Rd
- 1 Dolphin Ct
- 5527 Roaring Branch Rd
- 4 Stonehaven Ct
- 4 Dolphin Ct
- 5442 Roaring Branch Rd
- 5455 Stonehaven Dr
- 5537 Roaring Branch Rd
- 5528 Roaring Branch Rd
- 5 Stonehaven Ct
Your Personal Tour Guide
Ask me questions while you tour the home.