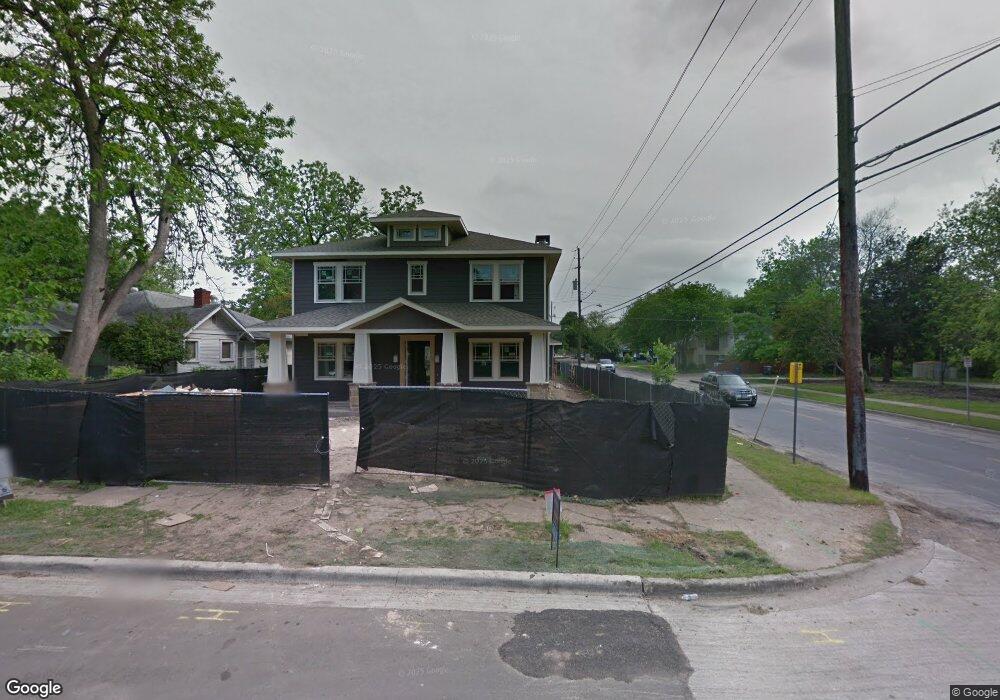
5502 Richard Ave Dallas, TX 75206
Lower Greenville NeighborhoodEstimated Value: $1,386,873 - $1,660,000
4
Beds
4
Baths
3,203
Sq Ft
$460/Sq Ft
Est. Value
About This Home
This home is located at 5502 Richard Ave, Dallas, TX 75206 and is currently estimated at $1,473,718, approximately $460 per square foot. 5502 Richard Ave is a home located in Dallas County with nearby schools including J L Long Middle School, Woodrow Wilson High School, and The Saint Timothy School.
Ownership History
Date
Name
Owned For
Owner Type
Purchase Details
Closed on
Jun 26, 2015
Sold by
Subdivision Realty 3 Llc
Bought by
Lawrence Kyle and Sauer Rebecca
Current Estimated Value
Home Financials for this Owner
Home Financials are based on the most recent Mortgage that was taken out on this home.
Original Mortgage
$696,600
Outstanding Balance
$528,735
Interest Rate
3.12%
Mortgage Type
Adjustable Rate Mortgage/ARM
Estimated Equity
$944,983
Purchase Details
Closed on
May 5, 2014
Sold by
Moxie Investments Ltd
Bought by
Subdivisions Realty 3 Llc
Home Financials for this Owner
Home Financials are based on the most recent Mortgage that was taken out on this home.
Original Mortgage
$144,000
Interest Rate
4.36%
Mortgage Type
Future Advance Clause Open End Mortgage
Purchase Details
Closed on
Oct 14, 1998
Sold by
Goza Tim
Bought by
Moxie Investment Ltd
Create a Home Valuation Report for This Property
The Home Valuation Report is an in-depth analysis detailing your home's value as well as a comparison with similar homes in the area
Home Values in the Area
Average Home Value in this Area
Purchase History
| Date | Buyer | Sale Price | Title Company |
|---|---|---|---|
| Lawrence Kyle | -- | None Available | |
| Subdivisions Realty 3 Llc | -- | None Available | |
| Moxie Investment Ltd | $56,577 | -- |
Source: Public Records
Mortgage History
| Date | Status | Borrower | Loan Amount |
|---|---|---|---|
| Open | Lawrence Kyle | $696,600 | |
| Previous Owner | Subdivisions Realty 3 Llc | $144,000 |
Source: Public Records
Tax History Compared to Growth
Tax History
| Year | Tax Paid | Tax Assessment Tax Assessment Total Assessment is a certain percentage of the fair market value that is determined by local assessors to be the total taxable value of land and additions on the property. | Land | Improvement |
|---|---|---|---|---|
| 2025 | $22,411 | $1,240,030 | $511,500 | $728,530 |
| 2024 | $22,411 | $1,240,030 | $511,500 | $728,530 |
| 2023 | $22,411 | $1,318,220 | $511,500 | $806,720 |
| 2022 | $28,487 | $1,139,300 | $383,630 | $755,670 |
| 2021 | $25,177 | $954,410 | $341,000 | $613,410 |
| 2020 | $25,121 | $926,000 | $341,000 | $585,000 |
| 2019 | $25,110 | $882,520 | $341,000 | $541,520 |
| 2018 | $23,998 | $882,520 | $341,000 | $541,520 |
| 2017 | $21,495 | $790,480 | $213,130 | $577,350 |
| 2016 | $17,889 | $790,480 | $213,130 | $577,350 |
| 2015 | $4,766 | $149,190 | $149,190 | $0 |
| 2014 | $4,766 | $173,770 | $149,190 | $24,580 |
Source: Public Records
Map
Nearby Homes
- 5448 Bonita Ave
- 5438 Bonita Ave
- 5535 Willis Ave
- 5451 Richmond Ave
- 5410 Belmont Ave
- 5627 Richard Ave
- 5419 Richmond Ave
- 5456 Richmond Ave
- 5630 Willis Ave
- 5335 Richard Ave
- 5636 Willis Ave
- 2210 Lola Ct
- 2026 Euclid Ave
- 5433 Melrose Ave
- 5322 Miller Ave
- 5711 Belmont Ave
- 2626 Madera St
- 5231 Manett St
- 1904 Mcmillan Ave
- 2107 Madera St
- 5506 Richard Ave
- 5510 Richard Ave
- 5458 Richard Ave
- 5512 Richard Ave
- 5501 Bonita Ave
- 5454 Richard Ave
- 5507 Bonita Ave
- 5509 Bonita Ave
- 5503 Richard Ave
- 5457 Bonita Ave
- 5518 Richard Ave
- 5516 Richard Ave
- 5505 Richard Ave
- 5448 Richard Ave
- 5515 Bonita Ave
- 5509 Richard Ave
- 5457 Richard Ave
- 5455 Bonita Ave
- 5519 Bonita Ave
- 5513 Richard Ave