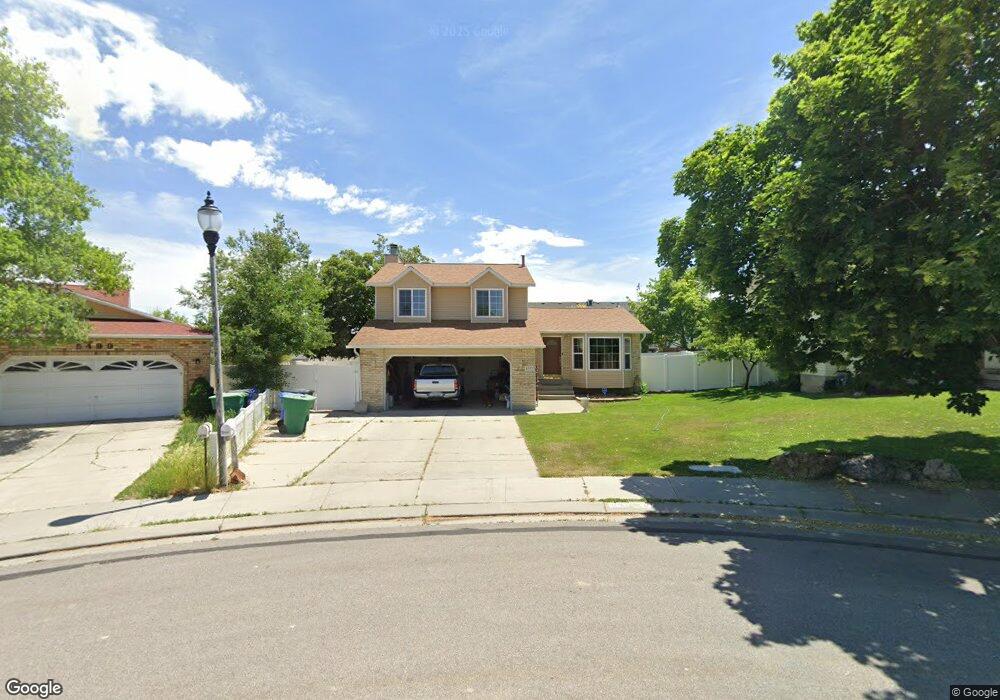
5503 W 6700 S West Jordan, UT 84081
Oquirrh NeighborhoodEstimated Value: $470,000 - $502,000
3
Beds
2
Baths
1,925
Sq Ft
$250/Sq Ft
Est. Value
About This Home
This home is located at 5503 W 6700 S, West Jordan, UT 84081 and is currently estimated at $481,751, approximately $250 per square foot. 5503 W 6700 S is a home located in Salt Lake County with nearby schools including Mountain Shadows School, West Hills Middle School, and Copper Hills High School.
Ownership History
Date
Name
Owned For
Owner Type
Purchase Details
Closed on
Nov 2, 2018
Sold by
Stockebrand Donna L
Bought by
Ardelean Mark D and Ardelean Nancy L
Current Estimated Value
Home Financials for this Owner
Home Financials are based on the most recent Mortgage that was taken out on this home.
Original Mortgage
$257,535
Outstanding Balance
$225,519
Interest Rate
4.6%
Mortgage Type
New Conventional
Estimated Equity
$256,232
Purchase Details
Closed on
May 20, 2005
Sold by
Milligan Stephen P
Bought by
Stockebrad Thomas A and Stockebrad Donna L
Home Financials for this Owner
Home Financials are based on the most recent Mortgage that was taken out on this home.
Original Mortgage
$29,980
Interest Rate
5.41%
Mortgage Type
Stand Alone Second
Purchase Details
Closed on
Feb 10, 2004
Sold by
Garcia Frank J and Garcia Susan K
Bought by
Milligan Stephen P
Create a Home Valuation Report for This Property
The Home Valuation Report is an in-depth analysis detailing your home's value as well as a comparison with similar homes in the area
Home Values in the Area
Average Home Value in this Area
Purchase History
| Date | Buyer | Sale Price | Title Company |
|---|---|---|---|
| Ardelean Mark D | -- | Vanguard Title Ins Agcy | |
| Stockebrad Thomas A | -- | Title One | |
| Milligan Stephen P | -- | -- |
Source: Public Records
Mortgage History
| Date | Status | Borrower | Loan Amount |
|---|---|---|---|
| Open | Ardelean Mark D | $257,535 | |
| Previous Owner | Stockebrad Thomas A | $29,980 |
Source: Public Records
Tax History Compared to Growth
Tax History
| Year | Tax Paid | Tax Assessment Tax Assessment Total Assessment is a certain percentage of the fair market value that is determined by local assessors to be the total taxable value of land and additions on the property. | Land | Improvement |
|---|---|---|---|---|
| 2025 | $2,563 | $453,700 | $105,100 | $348,600 |
| 2024 | $2,563 | $433,300 | $99,200 | $334,100 |
| 2023 | $2,565 | $407,400 | $95,300 | $312,100 |
| 2022 | $2,432 | $384,000 | $93,400 | $290,600 |
| 2021 | $2,153 | $315,500 | $71,900 | $243,600 |
| 2020 | $2,007 | $274,700 | $71,900 | $202,800 |
| 2019 | $1,962 | $262,700 | $67,800 | $194,900 |
| 2018 | $1,847 | $244,000 | $67,800 | $176,200 |
| 2017 | $1,629 | $212,100 | $67,800 | $144,300 |
| 2016 | $1,609 | $197,100 | $67,800 | $129,300 |
| 2015 | $1,469 | $173,600 | $67,600 | $106,000 |
| 2014 | $1,431 | $166,100 | $65,600 | $100,500 |
Source: Public Records
Map
Nearby Homes
- 5557 W Joshua Cir
- 5466 Ticklegrass Rd
- 5581 Bluevail Ct
- 6853 Mullien Dr Unit 5420
- 6739 S Sol Rise Dr
- 6839 S Cyclamen Dr
- 6922 Mullien Dr
- 5281 Saguaro Dr
- 6721 Adventure Way
- 7758 S Iron Core Ln
- 7146 W Owens View Way Unit 204
- 7259 W Cibola Rd
- 5732 W Moon Crest Ct
- 5579 W Lopalena Cir
- 6489 S Daffodil Way
- 5183 W Cadenza Dr
- 6568 S 5180 W
- 6698 Early Dawn Dr
- 7043 S Orion Hill Rd
- 6706 Marshrock Rd
- 5513 W 6700 S
- 5499 W 6700 S
- 5510 Saguaro Dr
- 5488 W Saguaro Dr
- 5510 W Saguaro Dr
- 6699 S 5500 W
- 5502 Saguaro Dr
- 5521 W 6700 S
- 5494 Saguaro Dr
- 5488 Saguaro Dr
- 5480 W Saguaro Dr
- 5518 Saguaro Dr
- 6694 S 5500 W
- 5518 W Saguaro Dr
- 5480 Saguaro Dr
- 6697 S 5500 W
- 6708 S Cyclamen Dr
- 6708 Cyclamen Dr
- 6698 S Cyclamen Dr
- 6698 Cyclamen Dr