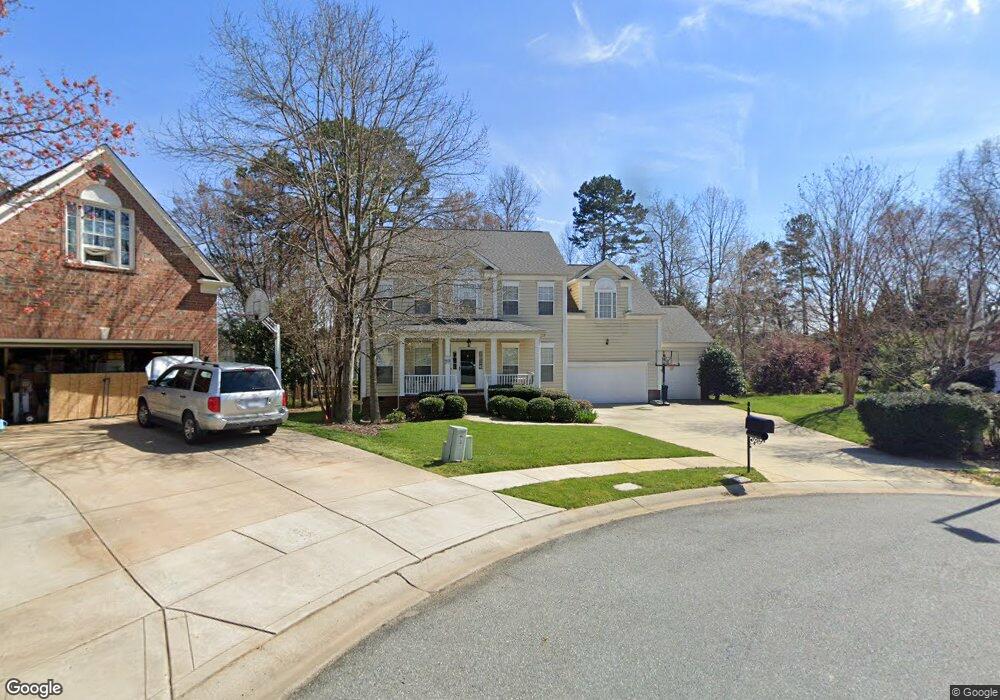
5504 Tullamore Ln Charlotte, NC 28269
Highland Creek NeighborhoodEstimated Value: $545,000 - $598,000
4
Beds
3
Baths
2,765
Sq Ft
$207/Sq Ft
Est. Value
About This Home
This home is located at 5504 Tullamore Ln, Charlotte, NC 28269 and is currently estimated at $572,800, approximately $207 per square foot. 5504 Tullamore Ln is a home located in Mecklenburg County with nearby schools including Highland Creek Elementary, Ridge Road Middle School, and Mallard Creek High School.
Ownership History
Date
Name
Owned For
Owner Type
Purchase Details
Closed on
Dec 6, 2004
Sold by
Smovrsnik Robert William and Smovrsnik Barbara
Bought by
Carte James D and Carte Louise M
Current Estimated Value
Home Financials for this Owner
Home Financials are based on the most recent Mortgage that was taken out on this home.
Original Mortgage
$203,200
Outstanding Balance
$93,341
Interest Rate
4.5%
Mortgage Type
Purchase Money Mortgage
Estimated Equity
$479,459
Purchase Details
Closed on
Jun 25, 2001
Sold by
Bradford David H and Bradford Anne B
Bought by
Srnovrsnik Robert William and Srnovrsnik Barbara
Home Financials for this Owner
Home Financials are based on the most recent Mortgage that was taken out on this home.
Original Mortgage
$176,000
Interest Rate
6.59%
Purchase Details
Closed on
May 29, 1998
Sold by
Beazer Homes Corp
Bought by
Bradford David H and Bradford Anne B
Home Financials for this Owner
Home Financials are based on the most recent Mortgage that was taken out on this home.
Original Mortgage
$160,000
Interest Rate
7.11%
Create a Home Valuation Report for This Property
The Home Valuation Report is an in-depth analysis detailing your home's value as well as a comparison with similar homes in the area
Home Values in the Area
Average Home Value in this Area
Purchase History
| Date | Buyer | Sale Price | Title Company |
|---|---|---|---|
| Carte James D | $254,000 | -- | |
| Srnovrsnik Robert William | $226,000 | -- | |
| Bradford David H | $220,000 | -- |
Source: Public Records
Mortgage History
| Date | Status | Borrower | Loan Amount |
|---|---|---|---|
| Open | Carte James D | $203,200 | |
| Previous Owner | Srnovrsnik Robert William | $176,000 | |
| Previous Owner | Bradford David H | $160,000 | |
| Closed | Carte James D | $25,400 |
Source: Public Records
Tax History Compared to Growth
Tax History
| Year | Tax Paid | Tax Assessment Tax Assessment Total Assessment is a certain percentage of the fair market value that is determined by local assessors to be the total taxable value of land and additions on the property. | Land | Improvement |
|---|---|---|---|---|
| 2025 | $3,714 | $470,200 | $104,500 | $365,700 |
| 2024 | $3,714 | $470,200 | $104,500 | $365,700 |
| 2023 | $3,143 | $470,200 | $104,500 | $365,700 |
| 2022 | $3,143 | $325,700 | $65,000 | $260,700 |
| 2021 | $3,258 | $325,700 | $65,000 | $260,700 |
| 2020 | $3,143 | $325,700 | $65,000 | $260,700 |
| 2019 | $3,235 | $325,700 | $65,000 | $260,700 |
| 2018 | $3,411 | $254,400 | $50,000 | $204,400 |
| 2017 | $3,356 | $254,400 | $50,000 | $204,400 |
| 2016 | $3,346 | $254,400 | $50,000 | $204,400 |
| 2015 | -- | $254,400 | $50,000 | $204,400 |
| 2014 | $3,330 | $0 | $0 | $0 |
Source: Public Records
Map
Nearby Homes
- 8437 Kilmartin Ln
- 5715 Hartfield Downs Dr
- 5728 Mantario Dr
- 7715 Wingmont Dr
- 8218 Lynnewood Glen Dr
- 5807 Mctaggart Ln
- 6003 Skyline Dr
- 7924 Fairmeadows Dr
- 8663 Meadowmont View Dr
- 5911 Swanston Dr
- 9341 Meadowmont View Dr
- 7238 Gallery Pointe Ln Unit 7238
- 9116 Meadowmont View Dr
- 3214 Grandeur Rd
- 8406 Highland Glen Dr Unit D
- 8612 Cedardale Ridge Ct
- 8538 Highland Glen Dr Unit 21A
- 8408 Brookings Dr
- 8572 Highland Glen Dr Unit 23A
- 8815 Laurel Run Dr
- 5508 Tullamore Ln
- 5500 Tullamore Ln
- 5403 Mcchesney Dr
- 5409 Mcchesney Dr
- 5319 Mcchesney Dr
- 5417 Mcchesney Dr
- 5311 Mcchesney Dr
- 5512 Tullamore Ln
- 5507 Tullamore Ln
- 5425 Mcchesney Dr
- 5303 Mcchesney Dr
- 5517 Tullamore Ln
- 5518 Tullamore Ln
- 5437 Mcchesney Dr
- 8310 Heathcrest Ct
- 8309 Heathcrest Ct
- 5523 Tullamore Ln
- 5501 Mcchesney Dr
- 5410 Mcchesney Dr
- 5524 Tullamore Ln