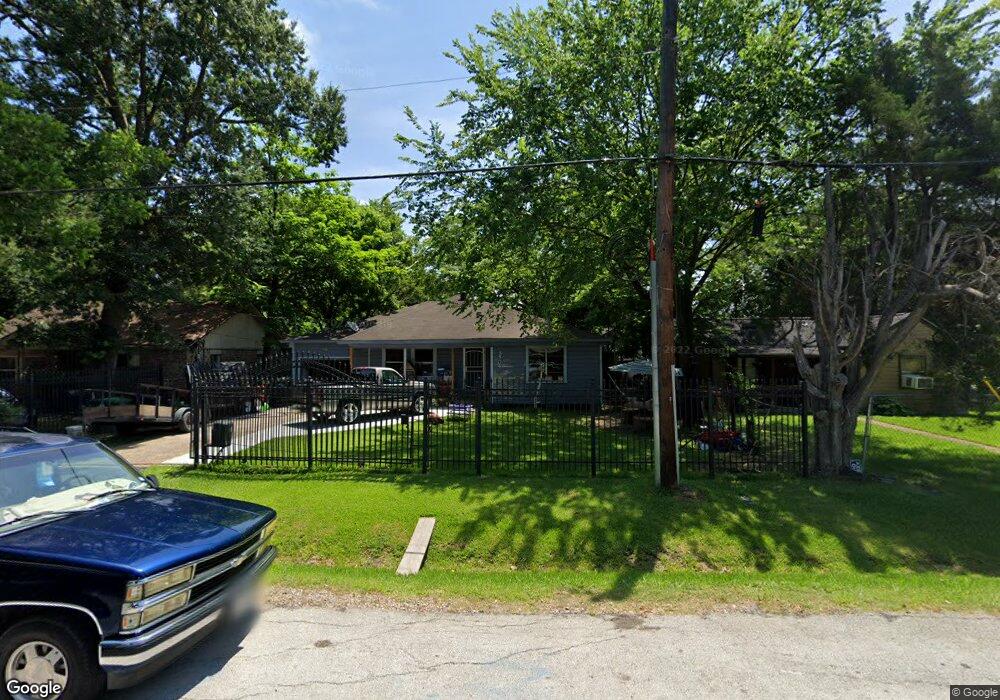
5504 Wipprecht St Houston, TX 77026
Trinity-Houston Gardens NeighborhoodEstimated Value: $155,000 - $265,000
3
Beds
2
Baths
1,712
Sq Ft
$123/Sq Ft
Est. Value
About This Home
This home is located at 5504 Wipprecht St, Houston, TX 77026 and is currently estimated at $210,224, approximately $122 per square foot. 5504 Wipprecht St is a home located in Harris County with nearby schools including Kashmere Gardens Elementary School, Key Middle, and Kashmere High School.
Ownership History
Date
Name
Owned For
Owner Type
Purchase Details
Closed on
Jan 15, 2014
Sold by
Morequity Inc
Bought by
Miller Nettie P
Current Estimated Value
Purchase Details
Closed on
Nov 6, 2012
Sold by
Small Ralph and Small Thelma
Bought by
Morequity Inc
Purchase Details
Closed on
Jul 16, 2007
Sold by
Gonzalez Jose A
Bought by
Small Ralph and Small Thelma
Home Financials for this Owner
Home Financials are based on the most recent Mortgage that was taken out on this home.
Original Mortgage
$82,650
Interest Rate
6.73%
Mortgage Type
Purchase Money Mortgage
Purchase Details
Closed on
Apr 28, 2006
Sold by
Thomas Cheryl Miller
Bought by
Gonzalez Jose A
Home Financials for this Owner
Home Financials are based on the most recent Mortgage that was taken out on this home.
Original Mortgage
$30,000
Interest Rate
6.33%
Mortgage Type
Fannie Mae Freddie Mac
Purchase Details
Closed on
Nov 13, 2004
Sold by
Miller Lucille Tuffley
Bought by
Thomas Cheryl Miller
Create a Home Valuation Report for This Property
The Home Valuation Report is an in-depth analysis detailing your home's value as well as a comparison with similar homes in the area
Home Values in the Area
Average Home Value in this Area
Purchase History
| Date | Buyer | Sale Price | Title Company |
|---|---|---|---|
| Miller Nettie P | -- | None Available | |
| Morequity Inc | $30,600 | None Available | |
| Small Ralph | -- | Fidelity National Title | |
| Gonzalez Jose A | -- | North American Title Co | |
| Thomas Cheryl Miller | -- | -- |
Source: Public Records
Mortgage History
| Date | Status | Borrower | Loan Amount |
|---|---|---|---|
| Previous Owner | Small Ralph | $82,650 | |
| Previous Owner | Gonzalez Jose A | $30,000 |
Source: Public Records
Tax History Compared to Growth
Tax History
| Year | Tax Paid | Tax Assessment Tax Assessment Total Assessment is a certain percentage of the fair market value that is determined by local assessors to be the total taxable value of land and additions on the property. | Land | Improvement |
|---|---|---|---|---|
| 2025 | $4,802 | $258,391 | $74,370 | $184,021 |
| 2024 | $4,802 | $229,510 | $61,050 | $168,460 |
| 2023 | $4,802 | $233,071 | $49,950 | $183,121 |
| 2022 | $4,146 | $188,308 | $31,635 | $156,673 |
| 2021 | $3,479 | $149,263 | $31,635 | $117,628 |
| 2020 | $2,693 | $111,193 | $21,090 | $90,103 |
| 2019 | $2,272 | $89,800 | $17,032 | $72,768 |
| 2018 | $1,446 | $57,138 | $18,315 | $38,823 |
| 2017 | $1,445 | $57,138 | $18,315 | $38,823 |
| 2016 | $1,369 | $54,132 | $16,650 | $37,482 |
| 2015 | -- | $54,132 | $16,650 | $37,482 |
| 2014 | -- | $115,295 | $16,650 | $98,645 |
Source: Public Records
Map
Nearby Homes
- 5618 Kashmere St
- 5305 Kashmere St
- 5217 Pickfair St
- 5609 Pickfair St
- 5210 Pickfair St
- 5013 Pardee St
- 4921 Wipprecht St
- 4921 Kashmere St
- 4916 Lavender St
- 4413 Kelley St
- 4818 Lavender St
- 5806 Hirsch Rd
- 0 Wipprecht St Unit 16984812
- 4421 Caplin St
- 5419 Pardee St
- 4717 Pickfair St
- 6221 Lavender St
- 4819 Los Angeles St
- 4817 Los Angeles St
- 6226 Kashmere St
- 4903 Fairbanks St
- 5512 Wipprecht St
- 4907 North Loop E
- 5514 Wipprecht St
- 4903 North Loop E
- 4913 S Fairbanks
- 4909 North Loop E
- 5602 Wipprecht St
- 5608 Wipprecht St
- 5505 Wipprecht St
- 5501 Wipprecht St
- 5610 Wipprecht St
- 5501 Lavender St
- 5509 Wipprecht St
- 5605 Lavender St
- 5505 Lavender St
- 5605 Wipprecht -Lot Only St
- 5601 Wipprecht St
- 5614 Wipprecht St
- 5605 Wipprecht St