5506 Garden Ridge Unit 5506 Columbus, OH 43228
Wexford-Thornapple NeighborhoodEstimated Value: $108,000 - $148,000
1
Bed
1
Bath
792
Sq Ft
$161/Sq Ft
Est. Value
About This Home
This home is located at 5506 Garden Ridge Unit 5506, Columbus, OH 43228 and is currently estimated at $127,333, approximately $160 per square foot. 5506 Garden Ridge Unit 5506 is a home located in Franklin County with nearby schools including Valleyview Elementary School, Westmoor Middle School, and West High School.
Ownership History
Date
Name
Owned For
Owner Type
Purchase Details
Closed on
Oct 29, 2019
Sold by
Nelson Rental Properties Llc
Bought by
Appleton Garry M and Appleton Stephen
Current Estimated Value
Home Financials for this Owner
Home Financials are based on the most recent Mortgage that was taken out on this home.
Original Mortgage
$600,000
Outstanding Balance
$405,133
Interest Rate
3.7%
Mortgage Type
Commercial
Estimated Equity
-$277,800
Purchase Details
Closed on
Jul 28, 2006
Sold by
Kds Acquisitions Llc
Bought by
Hoying Robert C
Home Financials for this Owner
Home Financials are based on the most recent Mortgage that was taken out on this home.
Original Mortgage
$65,600
Interest Rate
6.82%
Mortgage Type
Purchase Money Mortgage
Purchase Details
Closed on
Jun 29, 2005
Sold by
Bamm Properties Ltd
Bought by
Kds Acquisitions Llc
Create a Home Valuation Report for This Property
The Home Valuation Report is an in-depth analysis detailing your home's value as well as a comparison with similar homes in the area
Home Values in the Area
Average Home Value in this Area
Purchase History
| Date | Buyer | Sale Price | Title Company |
|---|---|---|---|
| Appleton Garry M | $589,000 | Stewart Ttl Agcy Of Cols Ltd | |
| Hoying Robert C | $72,900 | Talon Group | |
| Kds Acquisitions Llc | $780,000 | Talon Group |
Source: Public Records
Mortgage History
| Date | Status | Borrower | Loan Amount |
|---|---|---|---|
| Open | Appleton Garry M | $600,000 | |
| Previous Owner | Hoying Robert C | $65,600 |
Source: Public Records
Tax History Compared to Growth
Tax History
| Year | Tax Paid | Tax Assessment Tax Assessment Total Assessment is a certain percentage of the fair market value that is determined by local assessors to be the total taxable value of land and additions on the property. | Land | Improvement |
|---|---|---|---|---|
| 2024 | $2,683 | $39,200 | $7,000 | $32,200 |
| 2023 | $1,774 | $39,200 | $7,000 | $32,200 |
| 2022 | $1,219 | $22,930 | $3,500 | $19,430 |
| 2021 | $1,221 | $22,930 | $3,500 | $19,430 |
| 2020 | $1,223 | $22,930 | $3,500 | $19,430 |
| 2019 | $1,119 | $17,990 | $3,500 | $14,490 |
| 2018 | $1,390 | $17,990 | $3,500 | $14,490 |
| 2017 | $1,339 | $17,990 | $3,500 | $14,490 |
| 2016 | $1,560 | $22,960 | $2,590 | $20,370 |
| 2015 | $1,663 | $22,960 | $2,590 | $20,370 |
| 2014 | $1,181 | $19,040 | $2,590 | $16,450 |
| 2013 | $613 | $20,055 | $2,730 | $17,325 |
Source: Public Records
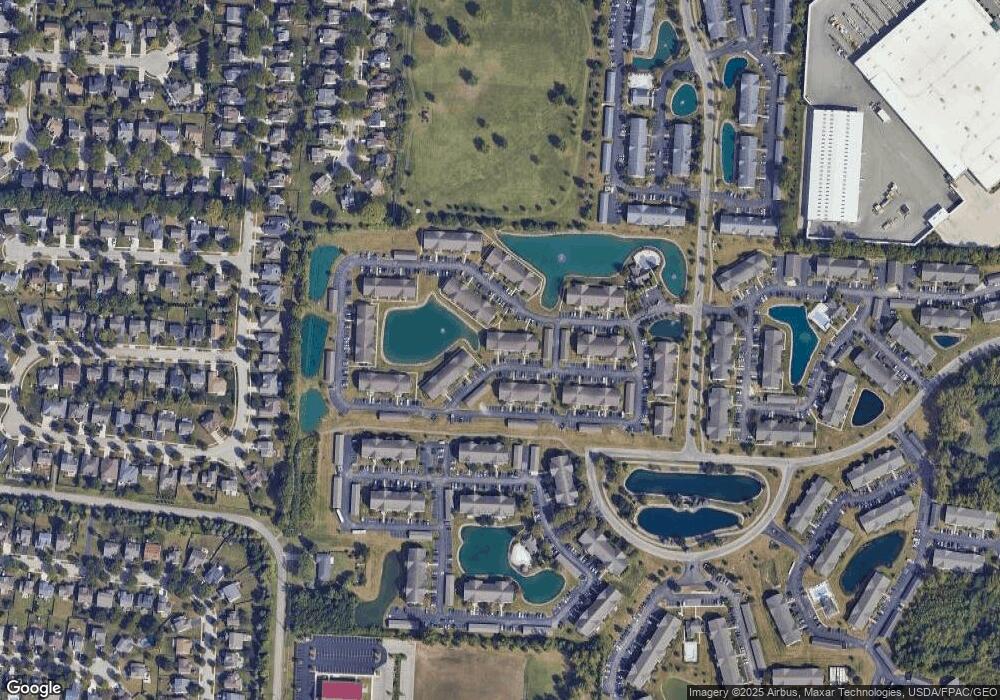
Map
Nearby Homes
- 5502 Cypress Chase Unit 5502
- 5488 Cedar Springs Unit 5488A
- 5536 Cedar Springs Unit 5536A
- 5617 Cedar Springs Unit 5617
- 952 Hartford Village Blvd Unit 952
- 960 Hartford Village Blvd
- 1024 Hartford Village Blvd Unit 1024
- 464 Assembly St Unit 53
- 1152 Kinneton Unit 1152
- 5536 Waldwick Unit 5536
- 378 Millett Dr
- 5688 Larksdale Dr
- 6029 Treaty Ln Unit 222
- 5946 Wellbrid Dr
- 1000 Thornapple Grove
- 976 William Penn Dr
- 5691 Duchess Ct
- 5819 Katara Dr
- 6037 Carmell Dr
- 0 Smith Rd Unit 225035308
- 5517 Cedar Springs Unit 5517A
- 5507 Cedar Springs Unit 5507A
- 5510 Garden Ridge Unit 5510
- 5511 Cedar Springs Unit 5511
- 5501 Cedar Springs Unit 5501
- 5501 Cedar Springs Unit R
- 5500 Garden Ridge Unit 5500
- 5491 Cedar Springs Unit 5491
- 5497 Cedar Springs Unit 5497A
- 5487 Cedar Springs Unit 5487
- 5497 Cedar Springs Unit R
- 5496 Garden Ridge Unit 5496
- 5543 Cedar Springs Unit 5632
- 5534 Garden Ridge Unit 5534
- 5532 Garden Ridge Unit 5532
- 5541 Cedar Springs Unit 5632
- 5490 Garden Ridge Unit 5490
- 5480 Garden Ridge Unit 5480
- 5481 Cedar Springs Unit 5481
- 5507 Garden Ridge Unit 5507