Estimated Value: $505,000 - $574,000
6
Beds
3
Baths
2,672
Sq Ft
$206/Sq Ft
Est. Value
About This Home
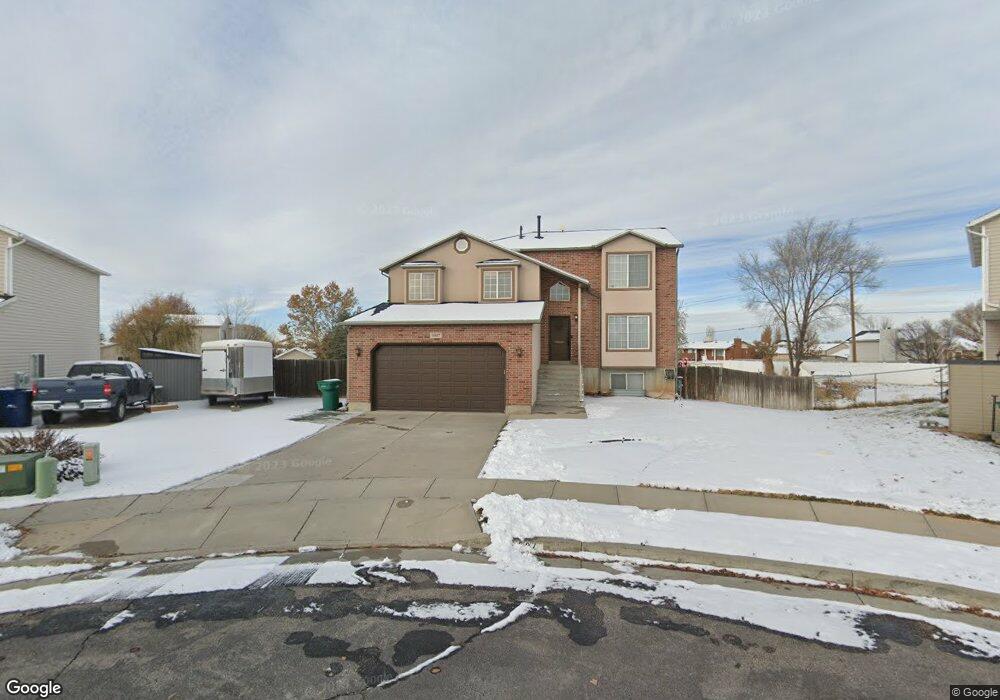
This home is located at 5507 S 3800 W, Roy, UT 84067 and is currently estimated at $551,549, approximately $206 per square foot. 5507 S 3800 W is a home located in Weber County with nearby schools including Midland School, Roy Junior High School, and Roy High School.
Ownership History
Date
Name
Owned For
Owner Type
Purchase Details
Closed on
Mar 16, 2021
Sold by
Vandyke Jon Robert and Vandyke Korilynn
Bought by
Harper Michael J
Current Estimated Value
Home Financials for this Owner
Home Financials are based on the most recent Mortgage that was taken out on this home.
Original Mortgage
$259,000
Outstanding Balance
$232,175
Interest Rate
2.7%
Mortgage Type
New Conventional
Estimated Equity
$319,374
Purchase Details
Closed on
Mar 19, 2014
Sold by
Bingham Brian and Bingham Alex
Bought by
Stevens Austin M and Stevens Cami
Home Financials for this Owner
Home Financials are based on the most recent Mortgage that was taken out on this home.
Original Mortgage
$212,325
Interest Rate
4.18%
Mortgage Type
New Conventional
Purchase Details
Closed on
Aug 30, 2001
Sold by
Shron Inc
Bought by
Bingham Brian and Bingham Alex
Home Financials for this Owner
Home Financials are based on the most recent Mortgage that was taken out on this home.
Original Mortgage
$155,795
Interest Rate
7.09%
Mortgage Type
FHA
Create a Home Valuation Report for This Property
The Home Valuation Report is an in-depth analysis detailing your home's value as well as a comparison with similar homes in the area
Home Values in the Area
Average Home Value in this Area
Purchase History
| Date | Buyer | Sale Price | Title Company |
|---|---|---|---|
| Harper Michael J | -- | First American Title Ins Co | |
| Stevens Austin M | -- | First American Title Co Llc | |
| Bingham Brian | -- | -- |
Source: Public Records
Mortgage History
| Date | Status | Borrower | Loan Amount |
|---|---|---|---|
| Open | Harper Michael J | $259,000 | |
| Previous Owner | Stevens Austin M | $212,325 | |
| Previous Owner | Bingham Brian | $155,795 |
Source: Public Records
Tax History Compared to Growth
Tax History
| Year | Tax Paid | Tax Assessment Tax Assessment Total Assessment is a certain percentage of the fair market value that is determined by local assessors to be the total taxable value of land and additions on the property. | Land | Improvement |
|---|---|---|---|---|
| 2025 | $3,389 | $546,134 | $171,622 | $374,512 |
| 2024 | $3,309 | $295,349 | $94,392 | $200,957 |
| 2023 | $3,193 | $285,450 | $84,827 | $200,623 |
| 2022 | $3,039 | $277,200 | $66,648 | $210,552 |
| 2021 | $2,600 | $391,000 | $91,556 | $299,444 |
| 2020 | $2,409 | $332,000 | $91,556 | $240,444 |
| 2019 | $2,304 | $299,000 | $59,559 | $239,441 |
| 2018 | $2,332 | $287,000 | $56,605 | $230,395 |
| 2017 | $2,177 | $251,000 | $56,605 | $194,395 |
| 2016 | $1,997 | $123,309 | $27,286 | $96,023 |
| 2015 | $1,985 | $126,157 | $27,286 | $98,871 |
| 2014 | $1,871 | $117,063 | $27,286 | $89,777 |
Source: Public Records
Map
Nearby Homes
- 3832 W 5625 S
- 3809 W 5625 S
- 3826 W 5750 S
- 3923 W 5700 S
- 5465 S 4050 W
- 3607 W 5400 S
- 3766 W 5300 S
- 5644 S 4075 W
- 3780 W 5850 S
- 5235 Midland Dr
- 5539 S 4175 W
- 5856 S 3950 W
- 5578 S 3450 W
- 5270 S 4200 W
- 5859 S 3500 W
- 4309 W 5430 St #B S
- 3443 W 5200 S Unit 2&3
- 3820 Foxglen Dr
- 4342 W 5430 S Unit B
- 4164 W 5950 S