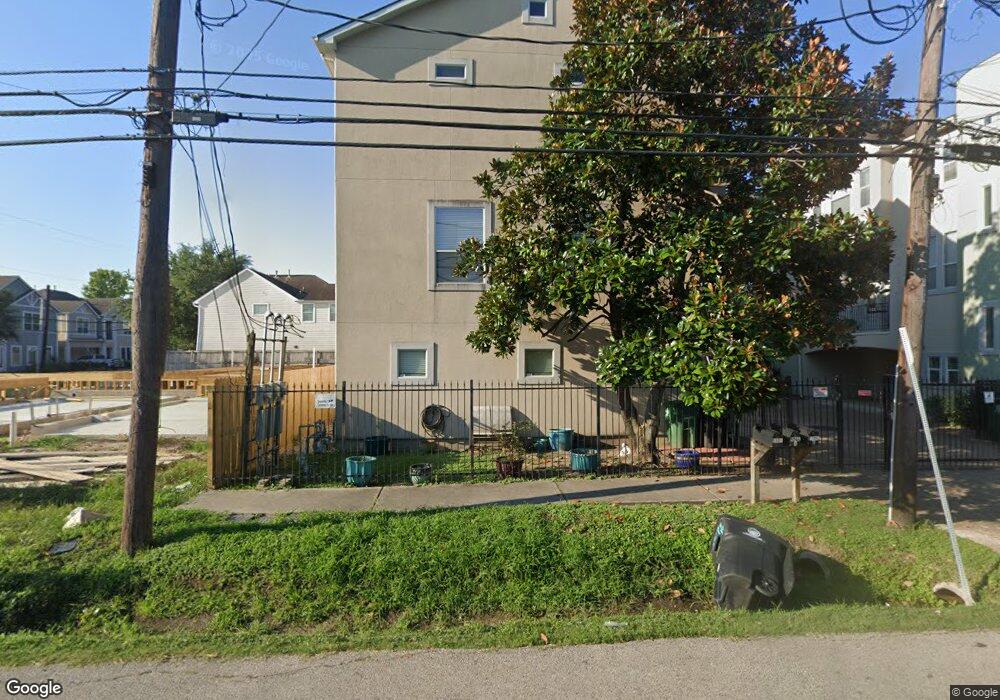
5509 Kansas St Unit A Houston, TX 77007
Cottage Grove NeighborhoodEstimated Value: $442,172 - $531,000
3
Beds
4
Baths
2,392
Sq Ft
$201/Sq Ft
Est. Value
About This Home
This home is located at 5509 Kansas St Unit A, Houston, TX 77007 and is currently estimated at $480,043, approximately $200 per square foot. 5509 Kansas St Unit A is a home located in Harris County with nearby schools including Memorial Elementary School, Hogg Middle, and Waltrip High School.
Ownership History
Date
Name
Owned For
Owner Type
Purchase Details
Closed on
Aug 24, 2017
Sold by
Barker Kevin and Barker Kevin W
Bought by
Tareen Ali S and Tareen Saleem A
Current Estimated Value
Home Financials for this Owner
Home Financials are based on the most recent Mortgage that was taken out on this home.
Original Mortgage
$258,750
Outstanding Balance
$138,384
Interest Rate
3.96%
Mortgage Type
New Conventional
Estimated Equity
$341,659
Purchase Details
Closed on
Sep 29, 2015
Sold by
Blanton Brandon and Hicks Russell A
Bought by
Barker Kevin W
Home Financials for this Owner
Home Financials are based on the most recent Mortgage that was taken out on this home.
Original Mortgage
$251,250
Interest Rate
3.97%
Mortgage Type
New Conventional
Purchase Details
Closed on
Feb 25, 2005
Sold by
Cmc Enterprise Inc
Bought by
Blanton Brandon and Hicks Russell A
Home Financials for this Owner
Home Financials are based on the most recent Mortgage that was taken out on this home.
Original Mortgage
$194,800
Interest Rate
6.25%
Mortgage Type
Purchase Money Mortgage
Create a Home Valuation Report for This Property
The Home Valuation Report is an in-depth analysis detailing your home's value as well as a comparison with similar homes in the area
Home Values in the Area
Average Home Value in this Area
Purchase History
| Date | Buyer | Sale Price | Title Company |
|---|---|---|---|
| Tareen Ali S | -- | Providence Title Co | |
| Barker Kevin W | -- | Startex Title Co | |
| Blanton Brandon | -- | Fidelity National Title |
Source: Public Records
Mortgage History
| Date | Status | Borrower | Loan Amount |
|---|---|---|---|
| Open | Tareen Ali S | $258,750 | |
| Previous Owner | Barker Kevin W | $251,250 | |
| Previous Owner | Blanton Brandon | $194,800 | |
| Closed | Blanton Brandon | $48,700 |
Source: Public Records
Tax History Compared to Growth
Tax History
| Year | Tax Paid | Tax Assessment Tax Assessment Total Assessment is a certain percentage of the fair market value that is determined by local assessors to be the total taxable value of land and additions on the property. | Land | Improvement |
|---|---|---|---|---|
| 2025 | $7,363 | $420,314 | $110,250 | $310,064 |
| 2024 | $7,363 | $413,732 | $110,250 | $303,482 |
| 2023 | $7,363 | $415,043 | $94,500 | $320,543 |
| 2022 | $8,231 | $374,603 | $86,625 | $287,978 |
| 2021 | $7,920 | $339,836 | $83,475 | $256,361 |
| 2020 | $8,048 | $332,328 | $78,750 | $253,578 |
| 2019 | $8,698 | $343,737 | $107,888 | $235,849 |
| 2018 | $7,495 | $335,000 | $86,310 | $248,690 |
| 2017 | $8,471 | $335,000 | $86,310 | $248,690 |
| 2016 | $8,471 | $335,000 | $86,310 | $248,690 |
| 2015 | $5,884 | $380,000 | $86,310 | $293,690 |
| 2014 | $5,884 | $300,000 | $75,521 | $224,479 |
Source: Public Records
Map
Nearby Homes
- 5522 Kiam St Unit A
- 2415 Radcliffe St
- 5525 Kiam St Unit A
- 2607 Cohn St
- 5609 Kansas St Unit C
- 5610 Kiam St Unit F
- 5525 Petty St Unit A
- 5413 Kiam St Unit B
- 5522 Darling St Unit A
- 5617 Kiam St Unit A
- 5507 Darling St
- 5406 Darling St Unit A
- 5636 Kiam St Unit B
- 5510 Larkin St Unit A
- 5637 Kiam St Unit D
- 5638 Petty St Unit B
- 2115 Radcliffe St
- 5429 Larkin St
- 5658 Darling St
- 5714 Kansas St
- 5509 Kansas St Unit B
- 5509 Kansas St
- 5509B Kansas St Unit B
- 5509B Kansas St
- 5507 Kansas St
- 5513 Kansas St Unit B
- 5513 Kansas St Unit A
- 5513 Kansas St
- 5511 Kansas St
- 2511 Radcliffe St
- 5512 Kiam St
- 5514 Kiam St
- 2509 Radcliffe St
- 5515 Kansas St
- 5516 Kiam St
- 5518 Kiam St
- 2507 Radcliffe St
- 5520 Kiam St
- 5520 Kiam St Unit C
- 5520 Kiam St Unit B