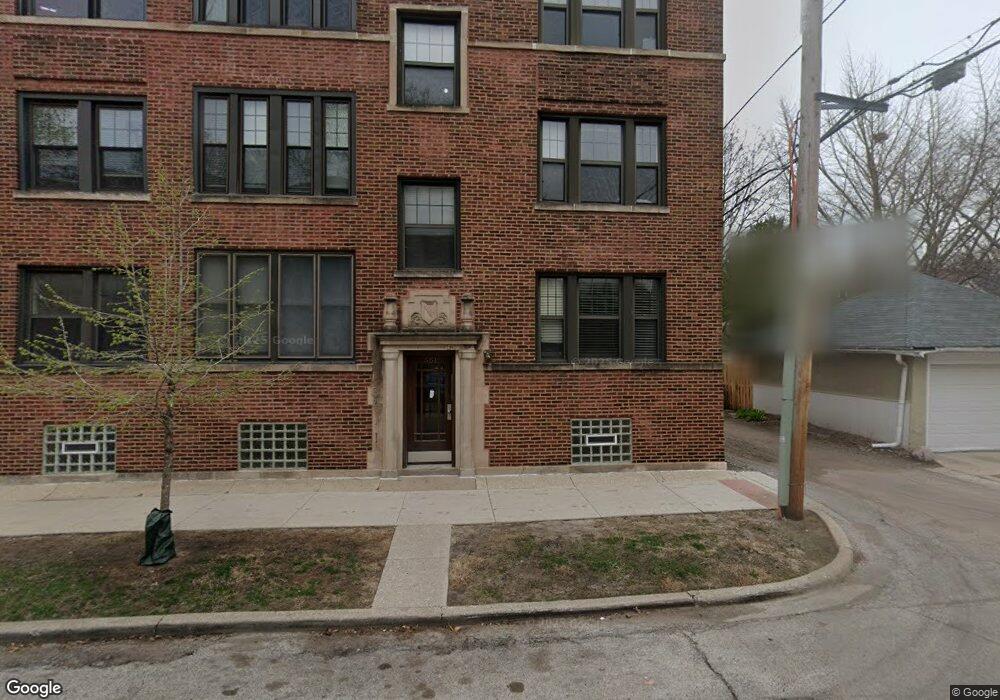
551 Elmwood Ave Unit 5511 Evanston, IL 60202
Southeast Evanston NeighborhoodEstimated Value: $200,747 - $233,000
1
Bed
1
Bath
891
Sq Ft
$243/Sq Ft
Est. Value
About This Home
This home is located at 551 Elmwood Ave Unit 5511, Evanston, IL 60202 and is currently estimated at $216,187, approximately $242 per square foot. 551 Elmwood Ave Unit 5511 is a home located in Cook County with nearby schools including Oakton Elementary School, Chute Middle School, and Evanston Township High School.
Ownership History
Date
Name
Owned For
Owner Type
Purchase Details
Closed on
Jul 20, 2016
Sold by
Byard Dori K
Bought by
Prince Danielle
Current Estimated Value
Home Financials for this Owner
Home Financials are based on the most recent Mortgage that was taken out on this home.
Original Mortgage
$132,500
Interest Rate
3.62%
Mortgage Type
New Conventional
Purchase Details
Closed on
Mar 30, 2004
Sold by
551 Elmwood Development Llc
Bought by
Scott Carol A
Home Financials for this Owner
Home Financials are based on the most recent Mortgage that was taken out on this home.
Original Mortgage
$102,200
Interest Rate
5.5%
Mortgage Type
Unknown
Purchase Details
Closed on
Nov 4, 2003
Sold by
551 Elmwood Development Llc
Bought by
Byard Dori K
Home Financials for this Owner
Home Financials are based on the most recent Mortgage that was taken out on this home.
Original Mortgage
$162,600
Interest Rate
5.62%
Mortgage Type
Unknown
Create a Home Valuation Report for This Property
The Home Valuation Report is an in-depth analysis detailing your home's value as well as a comparison with similar homes in the area
Home Values in the Area
Average Home Value in this Area
Purchase History
| Date | Buyer | Sale Price | Title Company |
|---|---|---|---|
| Prince Danielle | $142,500 | Citywide Title Corporation | |
| Scott Carol A | $176,000 | Ticor Title Insurance | |
| Byard Dori K | $157,000 | Ticor Title Insurance |
Source: Public Records
Mortgage History
| Date | Status | Borrower | Loan Amount |
|---|---|---|---|
| Previous Owner | Prince Danielle | $132,500 | |
| Previous Owner | Scott Carol A | $102,200 | |
| Previous Owner | Byard Dori K | $162,600 |
Source: Public Records
Tax History Compared to Growth
Tax History
| Year | Tax Paid | Tax Assessment Tax Assessment Total Assessment is a certain percentage of the fair market value that is determined by local assessors to be the total taxable value of land and additions on the property. | Land | Improvement |
|---|---|---|---|---|
| 2024 | $2,994 | $15,523 | $876 | $14,647 |
| 2023 | $2,848 | $15,523 | $876 | $14,647 |
| 2022 | $2,848 | $15,523 | $876 | $14,647 |
| 2021 | $2,464 | $12,490 | $691 | $11,799 |
| 2020 | $2,490 | $12,490 | $691 | $11,799 |
| 2019 | $2,481 | $13,882 | $691 | $13,191 |
| 2018 | $2,284 | $11,663 | $576 | $11,087 |
| 2017 | $2,240 | $11,663 | $576 | $11,087 |
| 2016 | $2,349 | $11,663 | $576 | $11,087 |
| 2015 | $2,661 | $12,409 | $484 | $11,925 |
| 2014 | $2,650 | $12,409 | $484 | $11,925 |
| 2013 | $2,573 | $12,409 | $484 | $11,925 |
Source: Public Records
Map
Nearby Homes
- 714 Seward St
- 828 Oakton St Unit 3F
- 1021 South Blvd
- 439 Ridge Ave Unit 2
- 553 Barton Ave
- 645 Custer Ave Unit 103
- 606B South Blvd
- SAN JUAN GRANDE La Cascabela
- 356 Ridge Ave Unit 6-2
- 428 Callan Ave
- 340 Ridge Ave Unit 1
- 647 Asbury Ave
- 608 Hinman Ave Unit 4S
- 836 Elmwood Ave Unit 2
- 835 Ridge Ave Unit 207
- 835 Ridge Ave Unit 507
- 811 Chicago Ave Unit 308
- 1217 Hull Terrace Unit 3A
- 250 Ridge Ave Unit 2J
- 515 Main St Unit 308
- 551 Elmwood Ave Unit 2
- 553 Elmwood Ave Unit 5532
- 551 Elmwood Ave Unit 5513
- 553 Elmwood Ave Unit 5533
- 551 Elmwood Ave Unit 5512
- 834 Elmwood Ave Unit 1
- 553 Elmwood Ave Unit 5531
- 551 Elmwood Ave Unit 4-1
- 551 Elmwood Ave Unit 56-3
- 551 Elmwood Ave Unit 4-3
- 551 Elmwood Ave Unit 52-2
- 553 Elmwood Ave Unit 52-2
- 553 Elmwood Ave
- 551 Elmwood Ave
- 551 Elmwood Ave Unit 50-2
- 553 Elmwood Ave Unit 3
- 551 Elmwood Ave Unit 1
- 551 Elmwood Ave Unit 3
- 553 Elmwood Ave Unit 2
- 555 Elmwood Ave Unit 3