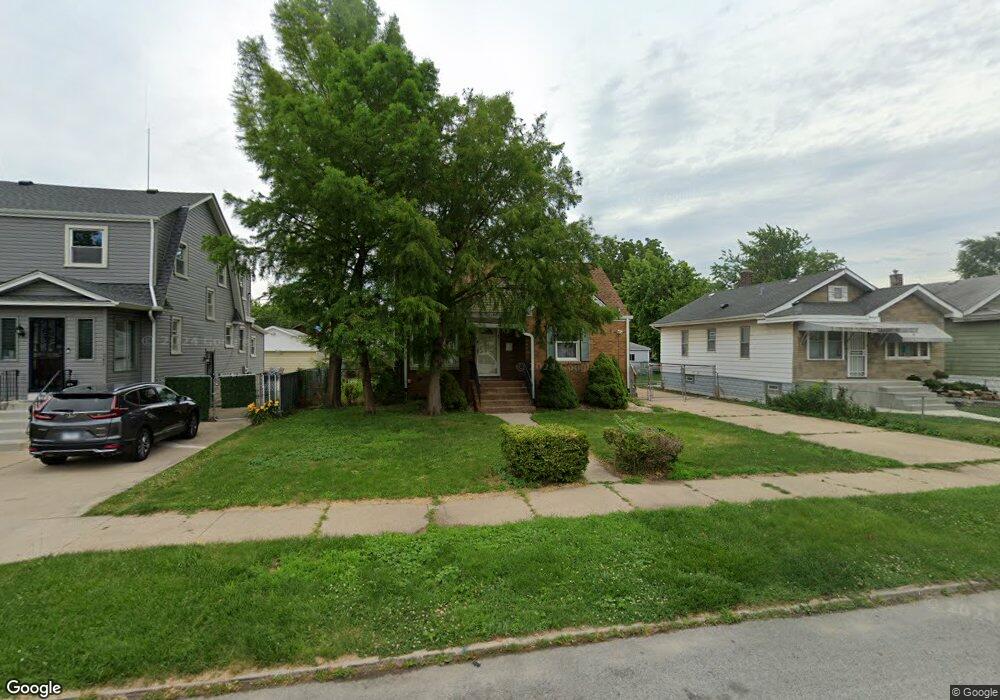
551 Gordon Ave Calumet City, IL 60409
Estimated Value: $175,034 - $244,000
4
Beds
2
Baths
1,532
Sq Ft
$129/Sq Ft
Est. Value
About This Home
This home is located at 551 Gordon Ave, Calumet City, IL 60409 and is currently estimated at $197,259, approximately $128 per square foot. 551 Gordon Ave is a home located in Cook County with nearby schools including Wilson Elementary School, Wentworth Intermediate School, and Wentworth Jr High School.
Ownership History
Date
Name
Owned For
Owner Type
Purchase Details
Closed on
Jan 22, 2021
Sold by
Landers James D
Bought by
Lynch Victoria V
Current Estimated Value
Home Financials for this Owner
Home Financials are based on the most recent Mortgage that was taken out on this home.
Original Mortgage
$123,500
Interest Rate
2.5%
Mortgage Type
New Conventional
Purchase Details
Closed on
Oct 31, 2002
Sold by
Dzugan Michael and Wimmer Jennifer
Bought by
Landers James D
Home Financials for this Owner
Home Financials are based on the most recent Mortgage that was taken out on this home.
Original Mortgage
$63,750
Interest Rate
7.5%
Mortgage Type
Unknown
Purchase Details
Closed on
Oct 25, 1999
Sold by
Wimmer Carmen R
Bought by
Dzugan Michael and Wimmer Jennifer
Purchase Details
Closed on
Jul 5, 1995
Sold by
Tanner Daniel G and Tanner Glenda
Bought by
Wimmer Carmen R
Create a Home Valuation Report for This Property
The Home Valuation Report is an in-depth analysis detailing your home's value as well as a comparison with similar homes in the area
Home Values in the Area
Average Home Value in this Area
Purchase History
| Date | Buyer | Sale Price | Title Company |
|---|---|---|---|
| Lynch Victoria V | $130,000 | Fidelity National Title | |
| Landers James D | $75,000 | Agtf Inc | |
| Dzugan Michael | -- | Agtf Inc | |
| Wimmer Carmen R | $88,000 | -- |
Source: Public Records
Mortgage History
| Date | Status | Borrower | Loan Amount |
|---|---|---|---|
| Previous Owner | Lynch Victoria V | $123,500 | |
| Previous Owner | Landers James D | $63,750 |
Source: Public Records
Tax History Compared to Growth
Tax History
| Year | Tax Paid | Tax Assessment Tax Assessment Total Assessment is a certain percentage of the fair market value that is determined by local assessors to be the total taxable value of land and additions on the property. | Land | Improvement |
|---|---|---|---|---|
| 2024 | $7,527 | $14,100 | $3,284 | $10,816 |
| 2023 | $3,808 | $15,000 | $3,284 | $11,716 |
| 2022 | $3,808 | $8,145 | $2,874 | $5,271 |
| 2021 | $3,732 | $8,144 | $2,873 | $5,271 |
| 2020 | $3,665 | $8,144 | $2,873 | $5,271 |
| 2019 | $4,447 | $9,250 | $2,668 | $6,582 |
| 2018 | $4,352 | $9,250 | $2,668 | $6,582 |
| 2017 | $4,249 | $9,250 | $2,668 | $6,582 |
| 2016 | $4,533 | $9,340 | $2,463 | $6,877 |
| 2015 | $4,371 | $9,340 | $2,463 | $6,877 |
| 2014 | $6,619 | $9,340 | $2,463 | $6,877 |
| 2013 | $4,719 | $10,780 | $2,463 | $8,317 |
Source: Public Records
Map
Nearby Homes
- 527 Gordon Ave
- 525 Price Ave
- 579 Freeland Ave
- 492 Freeland Ave
- 321 Memorial Dr
- 498 Harrison Ave
- 566 Hirsch Ave
- 309 Memorial Dr
- 580 Hirsch Ave
- 615 Price Ave
- 617 Hirsch Ave
- 305 153rd St
- 422 Sibley Blvd
- 655 Hirsch Ave
- 445 State St
- 348 Pulaski Rd
- 303 153rd Place
- 566 Ingraham Ave
- 409 Price Ave
- 502 Ingraham Ave
- 559 Gordon Ave
- 549 Gordon Ave
- 547 Gordon Ave
- 561 Gordon Ave
- 545 Gordon Ave
- 556 Freeland Ave
- 567 Gordon Ave
- 562 Freeland Ave
- 554 Freeland Ave
- 543 Gordon Ave
- 573 Gordon Ave
- 550 Freeland Ave
- 566 Freeland Ave
- 558 Gordon Ave
- 564 Gordon Ave
- 556 Gordon Ave
- 548 Freeland Ave
- 568 Gordon Ave
- 554 Gordon Ave
- 352 Memorial Dr