Estimated Value: $206,000 - $273,568
3
Beds
2
Baths
1,807
Sq Ft
$126/Sq Ft
Est. Value
About This Home
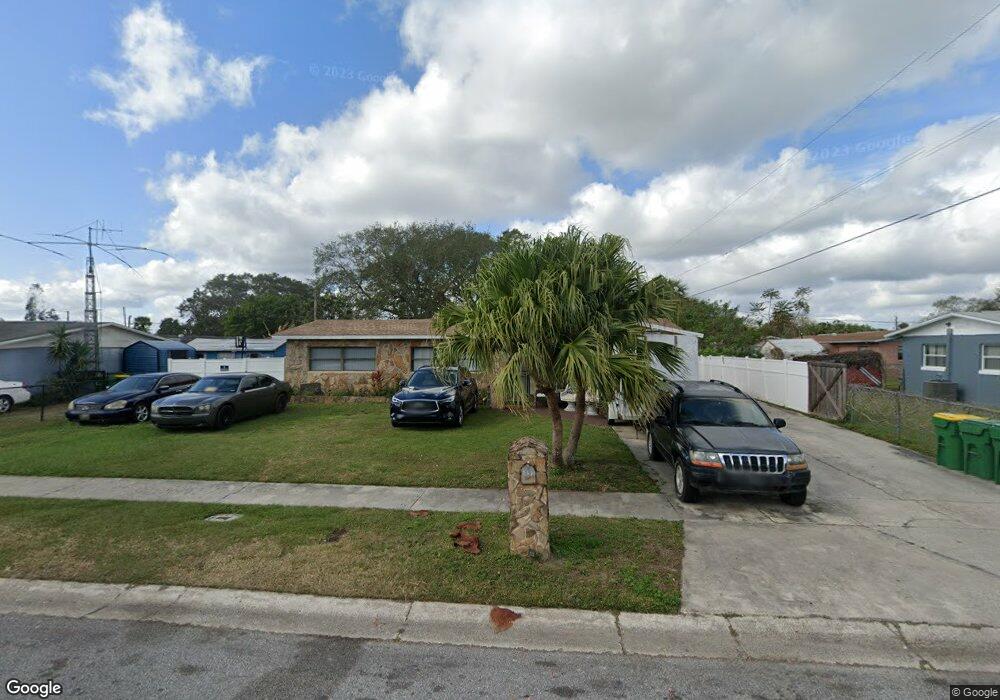
This home is located at 551 Grant St, Cocoa, FL 32926 and is currently estimated at $227,642, approximately $125 per square foot. 551 Grant St is a home located in Brevard County with nearby schools including Saturn Elementary School, Ronald McNair Magnet Middle School, and Rockledge Senior High School.
Ownership History
Date
Name
Owned For
Owner Type
Purchase Details
Closed on
Sep 26, 2017
Sold by
Chalk Chester A
Bought by
Hinson Sharon
Current Estimated Value
Purchase Details
Closed on
Jan 18, 2017
Sold by
Bell Latray
Bought by
Chalk Chester A
Purchase Details
Closed on
Sep 8, 2011
Sold by
Dixon Roxanna and Dotson Edward
Bought by
Bell Latray
Purchase Details
Closed on
Aug 28, 2008
Sold by
Federal Home Loan Mortgage Corporation
Bought by
Chalk Chester A
Purchase Details
Closed on
Jun 25, 2008
Sold by
Arnold Sherran
Bought by
Federal Home Loan Mortgage Corp
Purchase Details
Closed on
Jan 22, 2001
Sold by
Oster Warner
Bought by
Arnold Sherran
Home Financials for this Owner
Home Financials are based on the most recent Mortgage that was taken out on this home.
Original Mortgage
$59,170
Interest Rate
7.44%
Purchase Details
Closed on
Dec 2, 1999
Sold by
Clerk Circuit Court
Bought by
Oster Warner
Create a Home Valuation Report for This Property
The Home Valuation Report is an in-depth analysis detailing your home's value as well as a comparison with similar homes in the area
Home Values in the Area
Average Home Value in this Area
Purchase History
We collect this data history from publicly available records. To have your information removed, we recommend requesting removal directly through your county’s website.
| Date | Buyer | Sale Price | Title Company |
|---|---|---|---|
| Hinson Sharon | -- | None Available | |
| Chalk Chester A | -- | Attorney | |
| Bell Latray | $9,500 | None Available | |
| Chalk Chester A | $25,000 | Attorney | |
| Federal Home Loan Mortgage Corp | -- | Attorney | |
| Arnold Sherran | $61,000 | -- | |
| Oster Warner | $11,100 | -- |
Source: Public Records
Mortgage History
We collect this data history from publicly available records. To have your information removed, we recommend requesting removal directly through your county’s website.
| Date | Status | Borrower | Loan Amount |
|---|---|---|---|
| Previous Owner | Arnold Sherran | $59,170 |
Source: Public Records
Tax History
| Year | Tax Paid | Tax Assessment Tax Assessment Total Assessment is a certain percentage of the fair market value that is determined by local assessors to be the total taxable value of land and additions on the property. | Land | Improvement |
|---|---|---|---|---|
| 2025 | $1,333 | $91,170 | -- | -- |
| 2024 | $1,295 | $88,610 | -- | -- |
| 2023 | $1,295 | $86,030 | $0 | $0 |
| 2022 | $2,058 | $121,890 | $0 | $0 |
| 2021 | $1,935 | $98,190 | $10,000 | $88,190 |
| 2020 | $1,893 | $98,300 | $10,000 | $88,300 |
| 2019 | $1,873 | $97,920 | $10,000 | $87,920 |
| 2018 | $1,845 | $93,620 | $9,000 | $84,620 |
| 2017 | $1,648 | $79,420 | $9,000 | $70,420 |
| 2016 | $1,608 | $75,490 | $9,000 | $66,490 |
| 2015 | $1,494 | $62,810 | $9,000 | $53,810 |
| 2014 | $1,402 | $57,100 | $9,000 | $48,100 |
Source: Public Records
Map
Nearby Homes
Your Personal Tour Guide
Ask me questions while you tour the home.