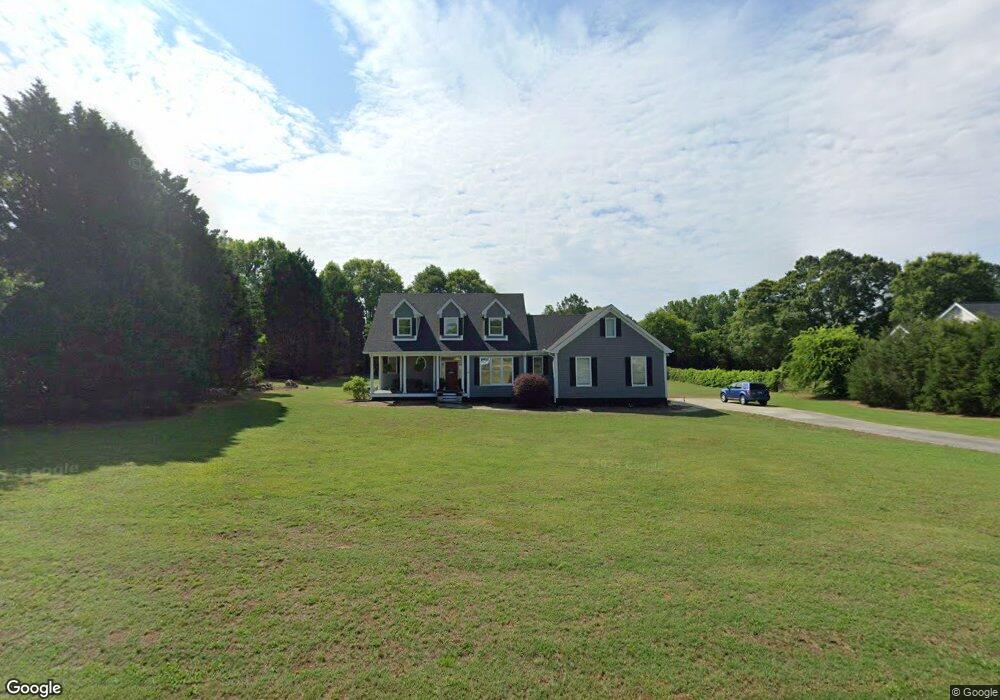
551 Indian Creek Trail Unit 8 Rutledge, GA 30663
Estimated Value: $375,965 - $444,000
3
Beds
3
Baths
1,827
Sq Ft
$227/Sq Ft
Est. Value
About This Home
This home is located at 551 Indian Creek Trail Unit 8, Rutledge, GA 30663 and is currently estimated at $414,741, approximately $227 per square foot. 551 Indian Creek Trail Unit 8 is a home located in Morgan County with nearby schools including Morgan County Primary School, Morgan County Elementary School, and Morgan County Middle School.
Ownership History
Date
Name
Owned For
Owner Type
Purchase Details
Closed on
Jun 12, 2020
Sold by
Burleson Alison T
Bought by
Glover Steven Jason
Current Estimated Value
Home Financials for this Owner
Home Financials are based on the most recent Mortgage that was taken out on this home.
Original Mortgage
$201,875
Outstanding Balance
$178,154
Interest Rate
3.2%
Mortgage Type
New Conventional
Estimated Equity
$236,587
Purchase Details
Closed on
Jun 27, 2007
Sold by
Tran Nang N
Bought by
Burleson Alison T
Home Financials for this Owner
Home Financials are based on the most recent Mortgage that was taken out on this home.
Original Mortgage
$182,400
Interest Rate
6.37%
Mortgage Type
New Conventional
Purchase Details
Closed on
Jun 7, 2002
Sold by
Tran Nang N
Bought by
Tran Nang N
Purchase Details
Closed on
Jun 6, 2002
Sold by
Medford Larry P
Bought by
Tran Nang N
Purchase Details
Closed on
Nov 30, 2000
Sold by
2Km Partnership
Bought by
Medford Larry P
Purchase Details
Closed on
Nov 6, 1989
Sold by
Bank Of Morgan County
Bought by
2Km Partnership
Create a Home Valuation Report for This Property
The Home Valuation Report is an in-depth analysis detailing your home's value as well as a comparison with similar homes in the area
Home Values in the Area
Average Home Value in this Area
Purchase History
| Date | Buyer | Sale Price | Title Company |
|---|---|---|---|
| Glover Steven Jason | $237,500 | -- | |
| Burleson Alison T | $192,000 | -- | |
| Tran Nang N | -- | -- | |
| Tran Nang N | $169,900 | -- | |
| Medford Larry P | -- | -- | |
| 2Km Partnership | -- | -- |
Source: Public Records
Mortgage History
| Date | Status | Borrower | Loan Amount |
|---|---|---|---|
| Open | Glover Steven Jason | $201,875 | |
| Previous Owner | Burleson Alison T | $182,400 |
Source: Public Records
Tax History Compared to Growth
Tax History
| Year | Tax Paid | Tax Assessment Tax Assessment Total Assessment is a certain percentage of the fair market value that is determined by local assessors to be the total taxable value of land and additions on the property. | Land | Improvement |
|---|---|---|---|---|
| 2025 | $2,784 | $125,377 | $18,000 | $107,377 |
| 2024 | $2,828 | $111,387 | $12,000 | $99,387 |
| 2023 | $2,567 | $98,277 | $8,000 | $90,277 |
| 2022 | $2,549 | $93,928 | $8,000 | $85,928 |
| 2021 | $2,560 | $93,928 | $8,000 | $85,928 |
| 2020 | $2,221 | $79,191 | $8,000 | $71,191 |
| 2019 | $2,255 | $79,191 | $8,000 | $71,191 |
| 2018 | $2,284 | $79,076 | $8,000 | $71,076 |
| 2017 | $2,238 | $76,362 | $11,200 | $65,162 |
| 2016 | $2,132 | $70,831 | $8,000 | $62,831 |
| 2015 | $2,076 | $68,000 | $8,000 | $60,000 |
| 2014 | $2,141 | $71,840 | $6,000 | $65,840 |
| 2013 | -- | $56,320 | $6,000 | $50,320 |
Source: Public Records
Map
Nearby Homes
- 0 Reese Rd Unit 10622381
- 0 Reese Rd Unit 25651133
- 294 Tuscany Dr
- 1151 Fears Rd
- 0 W Dixie Hwy Unit 10499573
- 0 Fairplay St Unit 10637174
- 3641 Davis Academy Rd
- 224 Hollis St
- 120 Hidden Falls Ct
- 0 Hawkins Academy Rd Unit 10561655
- 1031 Graham Dr
- 00 Fears Rd
- 00 Fears Rd
- 0 Fears Rd Unit 10569285
- 1310 Deerwood Dr
- 5521 Atlanta Hwy
- 5761 W Dixie Hwy
- 2470 Fears Rd
- 1051 Long Wood Dr
- 1051 Longwood Dr
- 551 Indian Creek Trail
- 549 Indian Creek Trail
- 553 Indian Creek Trail
- 553 Indian Creek Trail Unit 7
- 0 Indian Creek Trail Unit 10386016
- 0 Indian Creek Trail Unit 7463151
- 0 Indian Creek Trail Unit 10367025
- 0 Indian Creek Trail Unit 7411144
- 0 Indian Creek Trail Unit 10326980
- 0 Indian Creek Trail Unit 7038789
- 547 Indian Creek Trail
- 550 Cherokee Cir
- 552 Indian Creek Trail
- 545 Indian Creek Trail
- 559 Arrowhead Cir
- 0 Fairplay Prospect Rd Unit 8446482
- 111 Hidden Springs Dr
- 0 Fairplay Prospect Rd Unit 8417109
- 0 Fairplay Rd Unit 3 8412693
- 75.78 Ac Davis Acdemy Rd