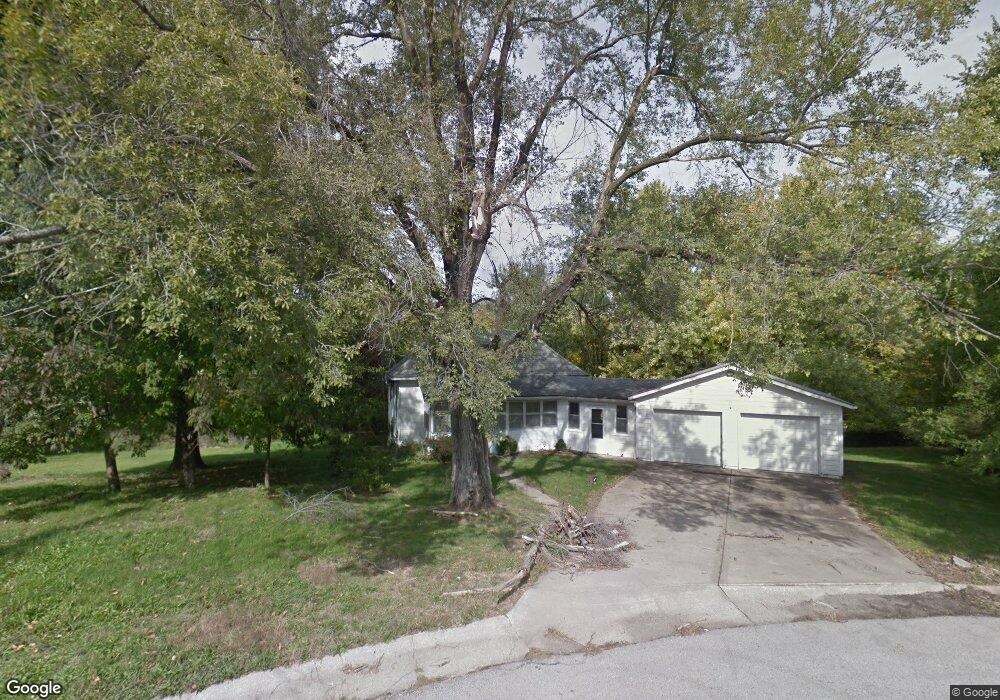
551 Orchard Place Excelsior Springs, MO 64024
Estimated Value: $142,000 - $187,204
2
Beds
1
Bath
916
Sq Ft
$182/Sq Ft
Est. Value
About This Home
This home is located at 551 Orchard Place, Excelsior Springs, MO 64024 and is currently estimated at $166,551, approximately $181 per square foot. 551 Orchard Place is a home located in Clay County with nearby schools including Excelsior Springs High School.
Ownership History
Date
Name
Owned For
Owner Type
Purchase Details
Closed on
Jan 25, 2017
Sold by
Roush Timothy
Bought by
Roush Michael J
Current Estimated Value
Purchase Details
Closed on
Aug 14, 2014
Sold by
Schirk Jay M
Bought by
Roush Timothy C
Purchase Details
Closed on
May 30, 2001
Sold by
Lowe Sheree R
Bought by
Schirk Jay M
Home Financials for this Owner
Home Financials are based on the most recent Mortgage that was taken out on this home.
Original Mortgage
$82,845
Interest Rate
7.07%
Mortgage Type
FHA
Purchase Details
Closed on
Aug 24, 1999
Sold by
Jackson Dorothy J
Bought by
Lowe Sheree R
Home Financials for this Owner
Home Financials are based on the most recent Mortgage that was taken out on this home.
Original Mortgage
$75,900
Interest Rate
7.65%
Purchase Details
Closed on
Apr 9, 1998
Sold by
Jackson Dorothy
Bought by
Jackson Roy T
Create a Home Valuation Report for This Property
The Home Valuation Report is an in-depth analysis detailing your home's value as well as a comparison with similar homes in the area
Home Values in the Area
Average Home Value in this Area
Purchase History
| Date | Buyer | Sale Price | Title Company |
|---|---|---|---|
| Roush Michael J | -- | None Available | |
| Roush Timothy C | $13,500 | None Available | |
| Schirk Jay M | -- | -- | |
| Lowe Sheree R | -- | First American Title Ins Co | |
| Jackson Roy T | -- | -- |
Source: Public Records
Mortgage History
| Date | Status | Borrower | Loan Amount |
|---|---|---|---|
| Previous Owner | Schirk Jay M | $82,845 | |
| Previous Owner | Lowe Sheree R | $75,900 |
Source: Public Records
Tax History Compared to Growth
Tax History
| Year | Tax Paid | Tax Assessment Tax Assessment Total Assessment is a certain percentage of the fair market value that is determined by local assessors to be the total taxable value of land and additions on the property. | Land | Improvement |
|---|---|---|---|---|
| 2025 | $1,260 | $19,420 | -- | -- |
| 2024 | $1,260 | $17,960 | -- | -- |
| 2023 | $1,252 | $17,960 | $0 | $0 |
| 2022 | $1,174 | $16,570 | $0 | $0 |
| 2021 | $1,179 | $16,568 | $2,280 | $14,288 |
| 2020 | $263 | $15,900 | $0 | $0 |
| 2019 | $1,163 | $15,903 | $2,280 | $13,623 |
| 2018 | $779 | $10,620 | $0 | $0 |
| 2017 | $772 | $10,620 | $2,280 | $8,340 |
| 2016 | $760 | $10,620 | $2,280 | $8,340 |
| 2015 | $767 | $10,620 | $2,280 | $8,340 |
| 2014 | $1,044 | $14,330 | $2,280 | $12,050 |
Source: Public Records
Map
Nearby Homes
- 547 Orchard Place
- 8 Orchard Place
- 821 St Louis Ave
- 811 Saint Louis Ave
- 108 Berton Rd
- 607 Old Orchard Ave
- 733 Magnolia Ave
- 117 Kevin St
- 124 Wildwood St
- 120 Wildwood St
- 114 Myrtle Ave
- 130 Kevin St
- 1004 Hickory St
- 101 W Excelsior St
- 216 Dunbar Ave
- 111 Collette St
- 106 Saratoga St
- 132 Cliff Dr
- 0 Park Ave
- Lot 3 Orrick Rd
- 4 Orchard Place
- 545 Orchard Place
- 543 Orchard Place
- 540 Old Orchard St
- 921 Orchard Place
- 917 Orchard Place
- 913 Orchard Place
- 913 Old Orchard St
- 711 S Kansas City Ave
- 705 S Kansas City Ave
- 911 Orchard Place
- 615 S Kansas City Ave
- 909 Orchard Place
- 703 S Kansas City Ave
- 905 Saint Louis Ave
- 710 Shirewood Rd
- 901 Saint Louis Ave
- 716 Shirewood Rd
- 831 Saint Louis Ave
- 718 Shirewood Rd