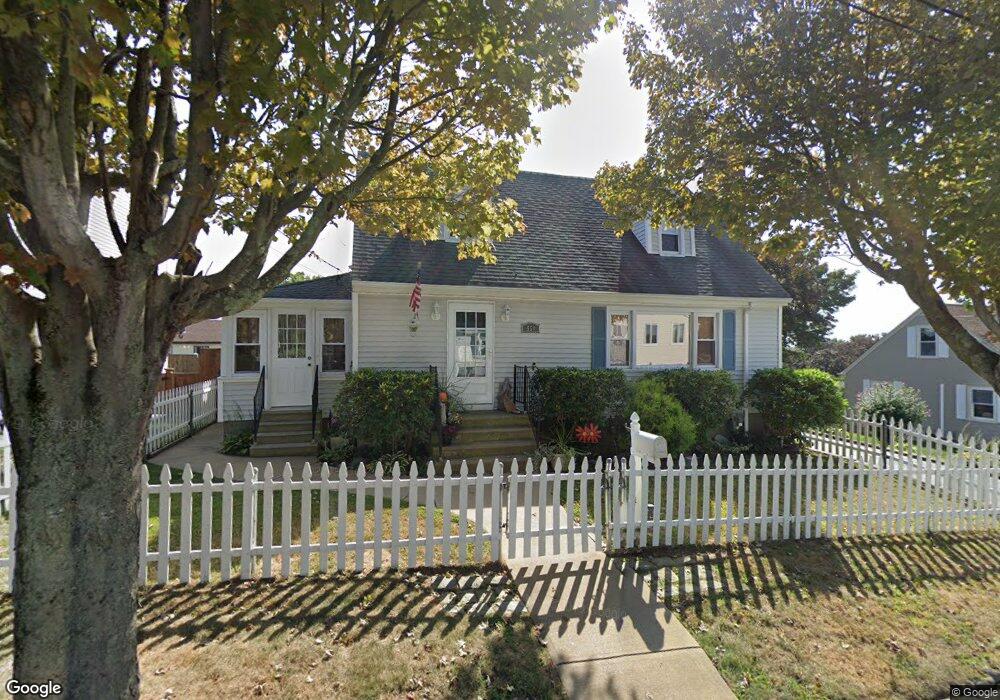
551 Orswell St Fall River, MA 02721
Maplewood NeighborhoodEstimated Value: $394,000 - $417,000
2
Beds
2
Baths
1,463
Sq Ft
$275/Sq Ft
Est. Value
About This Home
This home is located at 551 Orswell St, Fall River, MA 02721 and is currently estimated at $401,887, approximately $274 per square foot. 551 Orswell St is a home located in Bristol County with nearby schools including Letourneau Elementary School, Matthew J. Kuss Middle School, and B M C Durfee High School.
Ownership History
Date
Name
Owned For
Owner Type
Purchase Details
Closed on
Nov 26, 1997
Sold by
Fontaine Douglas
Bought by
Silvia Christopher A and Silvia Lynn Marie
Current Estimated Value
Purchase Details
Closed on
Feb 25, 1997
Sold by
Fontaine Nt
Bought by
Fonseca Albertino and Fonseca Laura
Purchase Details
Closed on
Aug 15, 1996
Sold by
Holding Janice E and Reback Brenda J
Bought by
Fontaine Douglas
Purchase Details
Closed on
Jun 29, 1994
Sold by
Dartmouth Land T
Bought by
Cherryfield Dev Inc
Create a Home Valuation Report for This Property
The Home Valuation Report is an in-depth analysis detailing your home's value as well as a comparison with similar homes in the area
Home Values in the Area
Average Home Value in this Area
Purchase History
| Date | Buyer | Sale Price | Title Company |
|---|---|---|---|
| Silvia Christopher A | $108,000 | -- | |
| Fonseca Albertino | $130,000 | -- | |
| Fontaine Douglas | $106,000 | -- | |
| Cherryfield Dev Inc | $40,000 | -- |
Source: Public Records
Mortgage History
| Date | Status | Borrower | Loan Amount |
|---|---|---|---|
| Open | Cherryfield Dev Inc | $140,000 | |
| Closed | Cherryfield Dev Inc | $139,000 |
Source: Public Records
Tax History Compared to Growth
Tax History
| Year | Tax Paid | Tax Assessment Tax Assessment Total Assessment is a certain percentage of the fair market value that is determined by local assessors to be the total taxable value of land and additions on the property. | Land | Improvement |
|---|---|---|---|---|
| 2025 | $3,829 | $334,400 | $115,400 | $219,000 |
| 2024 | $3,645 | $317,200 | $113,100 | $204,100 |
| 2023 | $3,675 | $299,500 | $101,900 | $197,600 |
| 2022 | $3,108 | $262,700 | $96,100 | $166,600 |
| 2021 | $3,108 | $224,700 | $91,800 | $132,900 |
| 2020 | $2,928 | $202,600 | $87,700 | $114,900 |
| 2019 | $2,950 | $202,300 | $91,600 | $110,700 |
| 2018 | $2,876 | $196,700 | $92,300 | $104,400 |
| 2017 | $2,730 | $195,000 | $92,300 | $102,700 |
| 2016 | $2,631 | $193,000 | $95,100 | $97,900 |
| 2015 | $2,531 | $193,500 | $95,100 | $98,400 |
| 2014 | $2,434 | $193,500 | $95,100 | $98,400 |
Source: Public Records
Map
Nearby Homes
- 539 Aetna St
- 59 Wayne St
- 478 Tucker St
- 80 Lane St
- 256 Rhode Island Ave
- 323 S Oxford St
- 125 Carl St
- 1553 Rodman St
- 306 Mott St
- 493 Peckham St
- 352 Vale St Unit 1
- 54 Grinnell St
- 340 Vale St
- 215 Cambridge St
- 59 Denver St
- 49 Stafford Rd
- 415 Anthony St
- 191 Glasgow St Unit 2
- 191 Glasgow St Unit 1
- 8 Gladding Place