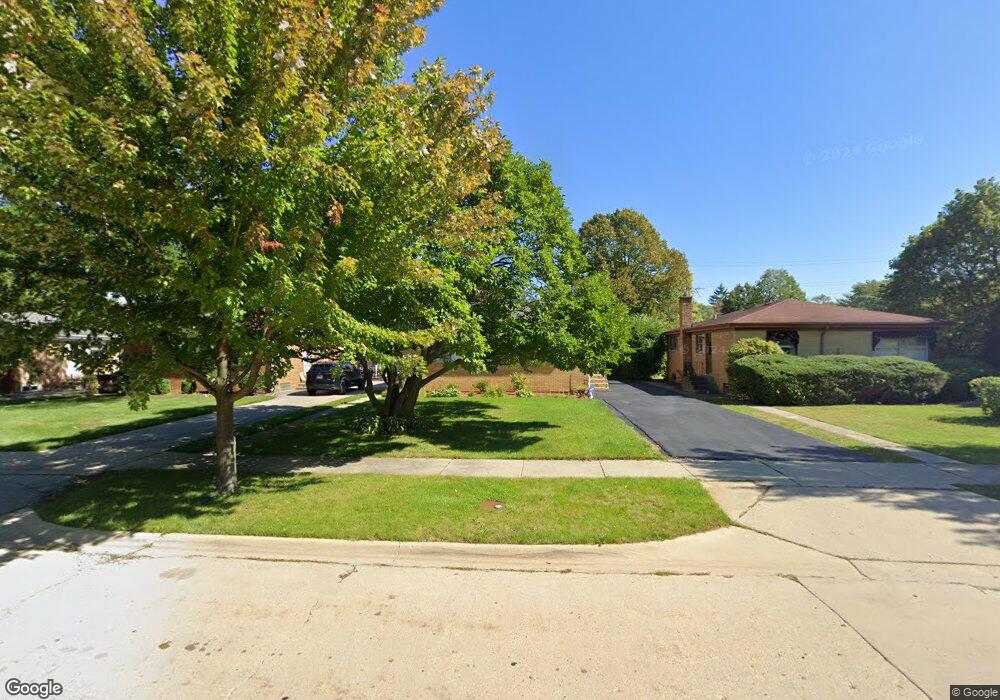
551 Sumac Rd Highland Park, IL 60035
West Highland Park NeighborhoodEstimated Value: $467,788 - $494,000
4
Beds
2
Baths
1,120
Sq Ft
$425/Sq Ft
Est. Value
About This Home
This home is located at 551 Sumac Rd, Highland Park, IL 60035 and is currently estimated at $475,697, approximately $424 per square foot. 551 Sumac Rd is a home located in Lake County with nearby schools including Sherwood Elementary School, Edgewood Middle School, and Highland Park High School.
Ownership History
Date
Name
Owned For
Owner Type
Purchase Details
Closed on
Mar 6, 2017
Sold by
Grandview Capital Llc
Bought by
Albandia Christopher and Albandia Lisa
Current Estimated Value
Home Financials for this Owner
Home Financials are based on the most recent Mortgage that was taken out on this home.
Original Mortgage
$2,511,750
Outstanding Balance
$2,094,351
Interest Rate
4.37%
Mortgage Type
New Conventional
Estimated Equity
-$1,618,654
Purchase Details
Closed on
Sep 15, 2016
Sold by
Pohn Jack S and Kaplan Joan
Bought by
Grandview Capital Llc
Purchase Details
Closed on
Oct 1, 2002
Sold by
Roberts Ethel H
Bought by
Pohn Jack S
Home Financials for this Owner
Home Financials are based on the most recent Mortgage that was taken out on this home.
Original Mortgage
$155,000
Interest Rate
4.5%
Purchase Details
Closed on
Nov 18, 1997
Sold by
Rappleye Joanne
Bought by
Roberts Ethel H
Create a Home Valuation Report for This Property
The Home Valuation Report is an in-depth analysis detailing your home's value as well as a comparison with similar homes in the area
Home Values in the Area
Average Home Value in this Area
Purchase History
| Date | Buyer | Sale Price | Title Company |
|---|---|---|---|
| Albandia Christopher | $295,500 | Chicago Title | |
| Grandview Capital Llc | $237,000 | Ct | |
| Pohn Jack S | $262,500 | Burnet Title Llc | |
| Roberts Ethel H | -- | -- |
Source: Public Records
Mortgage History
| Date | Status | Borrower | Loan Amount |
|---|---|---|---|
| Open | Albandia Christopher | $2,511,750 | |
| Previous Owner | Pohn Jack S | $155,000 |
Source: Public Records
Tax History Compared to Growth
Tax History
| Year | Tax Paid | Tax Assessment Tax Assessment Total Assessment is a certain percentage of the fair market value that is determined by local assessors to be the total taxable value of land and additions on the property. | Land | Improvement |
|---|---|---|---|---|
| 2024 | $9,186 | $124,930 | $43,628 | $81,302 |
| 2023 | $9,267 | $112,611 | $39,326 | $73,285 |
| 2022 | $9,267 | $108,805 | $43,202 | $65,603 |
| 2021 | $8,533 | $105,176 | $41,761 | $63,415 |
| 2020 | $8,257 | $105,176 | $41,761 | $63,415 |
| 2019 | $7,982 | $104,684 | $41,566 | $63,118 |
| 2018 | $7,245 | $98,015 | $45,852 | $52,163 |
| 2017 | $7,361 | $97,450 | $45,588 | $51,862 |
| 2016 | $5,902 | $88,039 | $43,401 | $44,638 |
| 2015 | $5,660 | $81,798 | $40,324 | $41,474 |
| 2014 | $4,602 | $66,290 | $39,512 | $26,778 |
| 2012 | $4,816 | $66,677 | $39,743 | $26,934 |
Source: Public Records
Map
Nearby Homes
- 666 Barberry Rd
- 1490 Avignon Ct
- 1816 Rosemary Rd
- 810 Virginia Rd
- 263 Barberry Rd
- 1039 Deerfield Place Unit 1039
- 1773 Winthrop Rd
- 1795 Lake Cook Rd Unit 110
- 1280 Rudolph Rd Unit 1
- 1220 Rudolph Rd Unit 3A
- 850 Evergreen Way
- 95 Greenbriar Dr E
- 75 Eastwood Dr
- 707 Brierhill Rd
- 717 Brierhill Rd
- 49 Larkdale Rd
- 1075 Heather Rd
- 1144 Green Bay Rd
- 75 Mulberry Rd
- 1744 Walnut Cir