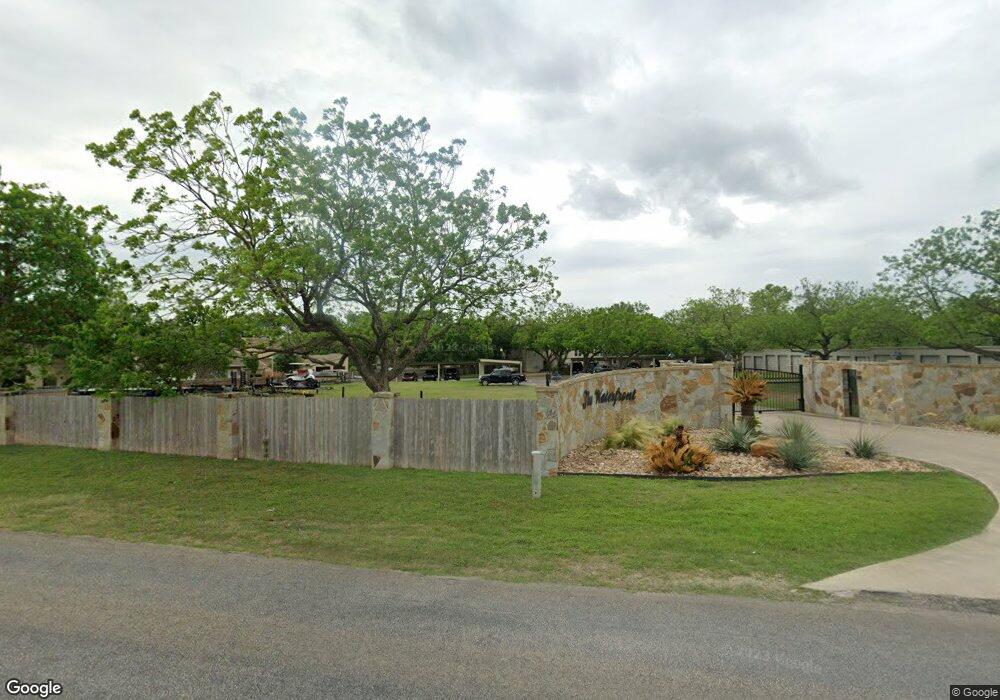
551 Terminal Loop Rd Mc Queeney, TX 78123
Estimated Value: $404,000 - $591,000
4
Beds
3
Baths
2,738
Sq Ft
$177/Sq Ft
Est. Value
About This Home
This home is located at 551 Terminal Loop Rd, Mc Queeney, TX 78123 and is currently estimated at $484,760, approximately $177 per square foot. 551 Terminal Loop Rd is a home located in Guadalupe County with nearby schools including Oralia R. Rodriguez Elementary School, Briesemeister Middle School, and Seguin High School.
Ownership History
Date
Name
Owned For
Owner Type
Purchase Details
Closed on
Oct 28, 2024
Sold by
Perry Homes Llc
Bought by
Vasquez Uzziel
Current Estimated Value
Home Financials for this Owner
Home Financials are based on the most recent Mortgage that was taken out on this home.
Original Mortgage
$440,910
Outstanding Balance
$435,127
Interest Rate
6.09%
Mortgage Type
New Conventional
Estimated Equity
$49,633
Purchase Details
Closed on
Jun 14, 2013
Sold by
Tooke Clay Michael and Tooke Cheryl Denise
Bought by
Dubois Joshua S and Dubois Holly C
Home Financials for this Owner
Home Financials are based on the most recent Mortgage that was taken out on this home.
Original Mortgage
$193,500
Interest Rate
3.43%
Mortgage Type
New Conventional
Purchase Details
Closed on
Aug 16, 2007
Sold by
Maxwell A Robert and Maxwell Betty
Bought by
Tooke Clay Michael and Tooke Cheryl Denise
Create a Home Valuation Report for This Property
The Home Valuation Report is an in-depth analysis detailing your home's value as well as a comparison with similar homes in the area
Home Values in the Area
Average Home Value in this Area
Purchase History
| Date | Buyer | Sale Price | Title Company |
|---|---|---|---|
| Vasquez Uzziel | -- | Executive Title Company | |
| Dubois Joshua S | -- | Five Star Title | |
| Tooke Clay Michael | -- | Five Star Title Llc |
Source: Public Records
Mortgage History
| Date | Status | Borrower | Loan Amount |
|---|---|---|---|
| Open | Vasquez Uzziel | $440,910 | |
| Previous Owner | Dubois Joshua S | $193,500 |
Source: Public Records
Tax History
| Year | Tax Paid | Tax Assessment Tax Assessment Total Assessment is a certain percentage of the fair market value that is determined by local assessors to be the total taxable value of land and additions on the property. | Land | Improvement |
|---|---|---|---|---|
| 2025 | $3,366 | $279,997 | $40,100 | $278,924 |
Source: Public Records
Map
Nearby Homes
- 551 Terminal Loop Rd Unit B3
- 0 Royal George Cir
- 207 Woodlake Dr
- 1317 Terminal Loop Rd
- TBD Fm 725
- 715 Happy Haven Rd
- 0000 Lakeside Dr
- 138 Fairwind Ln
- 253 Elm Dr
- 1650 Terminal Loop Rd
- 1670 Terminal Loop Rd
- 8195 Farm To Market Road 725
- 148 Arthur Ln
- 385 Gallagher Rd
- 1656 Pecan Dr NW
- 164 Cypress Way
- 279 Waltons Way
- 6814 Fm 725
- 249 Sandpiper Ln
- 1155 Ethel
- 551 Terminal Loop Rd Unit D5
- 551 Terminal Loop Rd Unit D6
- 551 Terminal Loop Rd
- 551 Terminal Loop Rd
- 551 Terminal Loop Rd
- 551 Terminal Loop Rd
- 551 Terminal Loop Rd
- 551 Terminal Loop Rd
- 551 Terminal Loop Rd Unit A
- 551 Terminal Loop Rd Unit A3
- 551 Terminal Loop Rd
- 551 Terminal Loop Rd Unit D8
- 551 Terminal Loop Rd Unit D1
- 551 Terminal Loop Rd
- 551 Terminal Loop Rd Unit A
- 551 Terminal Loop Rd Unit C4
- 551 Terminal Loop Rd Unit 5D
- 551 Terminal Loop Rd Unit D7
- 551 Terminal Loop Rd Unit 7D
- 551 Terminal Loop Rd Unit E1
Your Personal Tour Guide
Ask me questions while you tour the home.