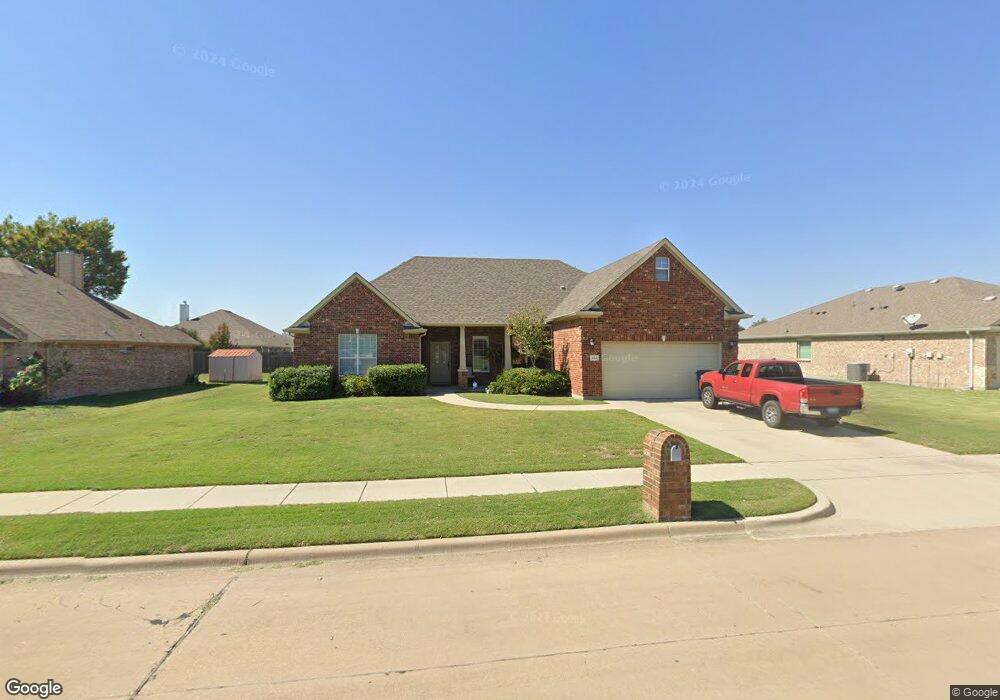
551 Tolleson Dr Celina, TX 75009
Estimated Value: $450,701 - $493,000
4
Beds
2
Baths
2,233
Sq Ft
$212/Sq Ft
Est. Value
About This Home
This home is located at 551 Tolleson Dr, Celina, TX 75009 and is currently estimated at $474,175, approximately $212 per square foot. 551 Tolleson Dr is a home located in Collin County with nearby schools including Celina Primary School, Marcy B. Lykins Elementary School, and Moore Middle School.
Ownership History
Date
Name
Owned For
Owner Type
Purchase Details
Closed on
Oct 15, 2024
Sold by
Rhoades Leonard Gene and Rhoades Evelyn Earnece
Bought by
Rhoades Living Trust and Rhoades
Current Estimated Value
Purchase Details
Closed on
Mar 26, 2010
Sold by
Texas Quality Investments Inc
Bought by
Rhoades Evelyn E and Rhoades Leonard Gene
Home Financials for this Owner
Home Financials are based on the most recent Mortgage that was taken out on this home.
Original Mortgage
$119,900
Interest Rate
5%
Mortgage Type
New Conventional
Purchase Details
Closed on
Jan 23, 2008
Sold by
Rockwood Development Llc
Bought by
Texas Quality Investments Inc and Texas Quality Homes
Home Financials for this Owner
Home Financials are based on the most recent Mortgage that was taken out on this home.
Original Mortgage
$168,587
Interest Rate
6.11%
Mortgage Type
Purchase Money Mortgage
Create a Home Valuation Report for This Property
The Home Valuation Report is an in-depth analysis detailing your home's value as well as a comparison with similar homes in the area
Home Values in the Area
Average Home Value in this Area
Purchase History
| Date | Buyer | Sale Price | Title Company |
|---|---|---|---|
| Rhoades Living Trust | -- | None Listed On Document | |
| Rhoades Evelyn E | -- | Stnt | |
| Texas Quality Investments Inc | -- | Stnt |
Source: Public Records
Mortgage History
| Date | Status | Borrower | Loan Amount |
|---|---|---|---|
| Previous Owner | Rhoades Evelyn E | $119,900 | |
| Previous Owner | Texas Quality Investments Inc | $168,587 |
Source: Public Records
Tax History Compared to Growth
Tax History
| Year | Tax Paid | Tax Assessment Tax Assessment Total Assessment is a certain percentage of the fair market value that is determined by local assessors to be the total taxable value of land and additions on the property. | Land | Improvement |
|---|---|---|---|---|
| 2025 | $1,861 | $462,006 | $150,000 | $312,006 |
| 2024 | $1,861 | $421,397 | $150,000 | $336,577 |
| 2023 | $1,861 | $383,088 | $120,000 | $327,357 |
| 2022 | $7,982 | $348,262 | $90,000 | $317,251 |
| 2021 | $7,393 | $316,602 | $65,000 | $251,602 |
| 2020 | $7,259 | $296,289 | $65,000 | $231,289 |
| 2019 | $7,063 | $277,300 | $55,000 | $246,850 |
| 2018 | $6,446 | $252,091 | $55,000 | $222,884 |
| 2017 | $5,860 | $259,581 | $45,000 | $214,581 |
| 2016 | $5,364 | $229,353 | $45,000 | $184,353 |
| 2015 | $3,458 | $203,134 | $35,000 | $168,134 |
Source: Public Records
Map
Nearby Homes
- 610 Cork Dr
- 931 W Cedar St
- 910 W Bois d Arc St
- 850 Mellanie Ct
- 516 S Alabama St
- 528 S Alabama Dr
- 611 W Sycamore St
- 557 S Utah Dr
- 611 W Ash St
- 607 W Ash St
- 413 Yellowstone Dr
- 614 S Georgia St
- 509 W Ash St
- 716 W Main St
- 715 W Main St
- 621 Cork Dr
- 514 S Arizona Dr
- 614 Cork Dr
- 629 Cork Dr
- 309 S Arizona Dr
- 571 Tolleson Dr
- 531 Tolleson Dr
- 610 Tolleson Dr
- 550 Stefhanie Dr
- 570 Stefhanie Dr
- 530 Stefhanie Dr
- 870 Derby Cir
- 870 Derby Ct
- 611 Tolleson Dr
- 511 Tolleson Dr
- 510 Stefhanie Dr
- 970 Derby Cir
- 970 W Ash St
- 610 Stefhanie Dr
- 890 Derby Cir
- 631 Tolleson Dr
- 960 Derby Ct
- 950 W Ash St
- 960 Derby Cir
- 630 Stefhanie Dr