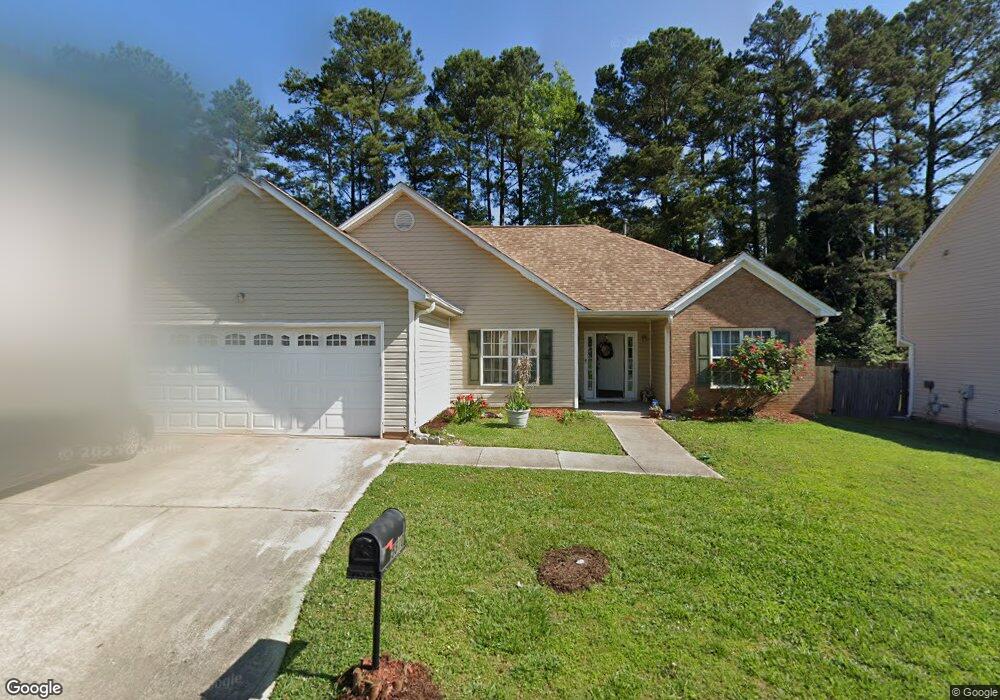
5510 Mayfair Crossing Dr Unit 8 Lithonia, GA 30038
Estimated Value: $244,000 - $257,000
3
Beds
2
Baths
1,565
Sq Ft
$160/Sq Ft
Est. Value
About This Home
This home is located at 5510 Mayfair Crossing Dr Unit 8, Lithonia, GA 30038 and is currently estimated at $250,195, approximately $159 per square foot. 5510 Mayfair Crossing Dr Unit 8 is a home located in DeKalb County with nearby schools including Fairington Elementary School, Salem Middle School, and Martin Luther King- Jr. High School.
Ownership History
Date
Name
Owned For
Owner Type
Purchase Details
Closed on
Jun 5, 2024
Sold by
Nimely Jugbeh
Bought by
Smith Angela and Smith Brehannah
Current Estimated Value
Purchase Details
Closed on
Aug 26, 2020
Sold by
Crowder Karen
Bought by
Nimely Jugbeh
Home Financials for this Owner
Home Financials are based on the most recent Mortgage that was taken out on this home.
Original Mortgage
$148,265
Interest Rate
2.9%
Mortgage Type
FHA
Purchase Details
Closed on
Jun 24, 2005
Sold by
Estate Of Gussie K Anderson
Bought by
Crowder Karen and Kitchens Alvin
Purchase Details
Closed on
Nov 24, 1997
Sold by
Mcmillan Mcdonald Builders Inc
Bought by
Anderson Gussie K
Create a Home Valuation Report for This Property
The Home Valuation Report is an in-depth analysis detailing your home's value as well as a comparison with similar homes in the area
Home Values in the Area
Average Home Value in this Area
Purchase History
| Date | Buyer | Sale Price | Title Company |
|---|---|---|---|
| Smith Angela | $249,400 | -- | |
| Nimely Jugbeh | $151,000 | -- | |
| Crowder Karen | -- | -- | |
| Anderson Gussie K | $100,000 | -- |
Source: Public Records
Mortgage History
| Date | Status | Borrower | Loan Amount |
|---|---|---|---|
| Previous Owner | Nimely Jugbeh | $148,265 | |
| Closed | Anderson Gussie K | -- |
Source: Public Records
Tax History Compared to Growth
Tax History
| Year | Tax Paid | Tax Assessment Tax Assessment Total Assessment is a certain percentage of the fair market value that is determined by local assessors to be the total taxable value of land and additions on the property. | Land | Improvement |
|---|---|---|---|---|
| 2025 | $3,376 | $102,920 | $20,000 | $82,920 |
| 2024 | $5,006 | $102,320 | $20,000 | $82,320 |
| 2023 | $5,006 | $92,240 | $16,000 | $76,240 |
| 2022 | $3,828 | $79,040 | $9,520 | $69,520 |
| 2021 | $3,050 | $60,400 | $9,360 | $51,040 |
| 2020 | $2,691 | $52,880 | $9,480 | $43,400 |
| 2019 | $2,626 | $51,760 | $9,480 | $42,280 |
| 2018 | $2,155 | $45,440 | $9,480 | $35,960 |
| 2017 | $2,273 | $43,520 | $9,480 | $34,040 |
| 2016 | $2,206 | $41,920 | $9,480 | $32,440 |
| 2014 | $1,205 | $18,800 | $9,480 | $9,320 |
Source: Public Records
Map
Nearby Homes
- 177 Rue Fontaine Unit 2
- 5556 Claridge Cir Unit 1
- 38 Le Parc Fontaine
- 54 Le Parc Fontaine
- 125 Rue Fontaine
- 3026 Highland Park Ln Unit II
- 3027 Fair Creek Ct
- 5585 Fairington Place
- 2700 Norfair Loop
- 5614 Regency Forest Ct
- 5437 Winslow Crossing N
- 2892 Norfair Loop
- 9 Willowick Dr
- 2878 Norfair Loop
- 2799 Keystone Ave
- 2793 Keystone Ave
- 28 Willowick Dr
- 2794 Keystone Ave Unit 26
- 3304 Fairington Village Dr
- 3204 Fairington Village Dr
- 5510 Mayfair Crossing Dr
- 5516 Mayfair Crossing Dr
- 5506 Mayfair Crossing Dr Unit I
- 5520 Mayfair Crossing Dr Unit 1
- 5500 Mayfair Crossing Dr
- 5507 Mayfair Crossing Dr
- 5526 Mayfair Crossing Dr
- 5519 Mayfair Crossing Dr Unit I
- 5494 Mayfair Crossing Dr
- 5499 Mayfair Crossing Dr
- 3084 Highland Park Ln Unit II
- 5490 Mayfair Crossing Dr
- 5532 Mayfair Crossing Dr Unit 1
- 5493 Mayfair Crossing Dr
- 2930 Highland Park Cir
- 192 Rue Fontaine Unit 192
- 3078 Highland Park Ln
- 5535 Mayfair Crossing Dr Unit 1
- 191 Rue Fontaine Unit 191
- 5484 Mayfair Crossing Dr Unit 1