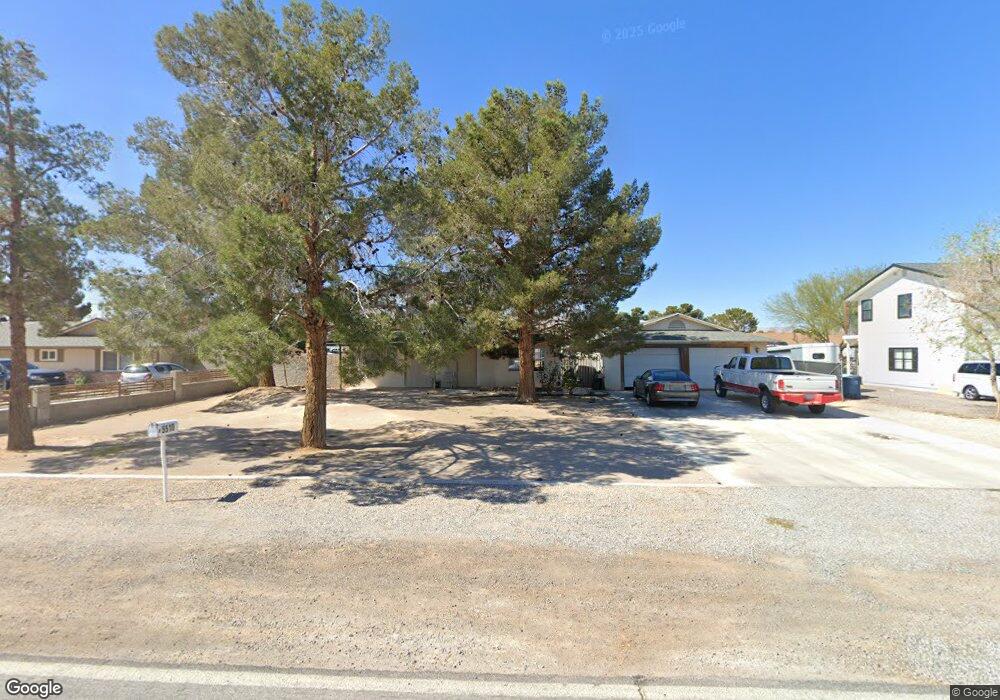
5510 N Torrey Pines Dr Las Vegas, NV 89130
North Cheyenne NeighborhoodEstimated Value: $467,697 - $476,000
4
Beds
2
Baths
1,300
Sq Ft
$363/Sq Ft
Est. Value
About This Home
This home is located at 5510 N Torrey Pines Dr, Las Vegas, NV 89130 and is currently estimated at $471,674, approximately $362 per square foot. 5510 N Torrey Pines Dr is a home located in Clark County with nearby schools including Ernest May Elementary School, Theron L Swainston Middle School, and Shadow Ridge High School.
Create a Home Valuation Report for This Property
The Home Valuation Report is an in-depth analysis detailing your home's value as well as a comparison with similar homes in the area
Home Values in the Area
Average Home Value in this Area
Tax History Compared to Growth
Tax History
| Year | Tax Paid | Tax Assessment Tax Assessment Total Assessment is a certain percentage of the fair market value that is determined by local assessors to be the total taxable value of land and additions on the property. | Land | Improvement |
|---|---|---|---|---|
| 2025 | $1,827 | $102,479 | $61,250 | $41,229 |
| 2024 | $1,775 | $102,479 | $61,250 | $41,229 |
| 2023 | $1,775 | $100,533 | $61,250 | $39,283 |
| 2022 | $1,723 | $80,113 | $43,750 | $36,363 |
| 2021 | $1,673 | $76,844 | $42,000 | $34,844 |
| 2020 | $1,621 | $73,416 | $38,500 | $34,916 |
| 2019 | $1,574 | $60,818 | $26,250 | $34,568 |
| 2018 | $1,528 | $65,846 | $32,200 | $33,646 |
| 2017 | $2,172 | $66,260 | $31,850 | $34,410 |
| 2016 | $1,448 | $55,992 | $22,750 | $33,242 |
| 2015 | $1,444 | $47,582 | $17,063 | $30,519 |
| 2014 | $1,402 | $41,497 | $18,200 | $23,297 |
Source: Public Records
Map
Nearby Homes
- 6400 W Ann Rd
- 6345 Cinnabar Ridge Ave
- 6345 Citrine Ave
- 6405 Steamship Ct
- 5635 Portage Lake Ct
- 5329 Bright Sun Ct
- 5508 Jasper Butte St
- 6405 Break Point Ave
- 6540 W Hammer Ln
- 6301 Malachite Bay Ave
- 6613 Sand Bench Ave
- 6620 Gray Juniper Ave
- 6116 Camas Canyon Ave
- 6513 Echo Crest Ave
- 6129 Desert Haven Rd
- 6109 Sandstone Mesa Dr
- 5409 Flora Spray St
- 6113 Desert Haven Rd
- 5712 Grand Guiness Ct
- 6679 Alpine Brooks Ave
- 5500 N Torrey Pines Dr
- 5520 N Torrey Pines Dr
- 6416 Tina Ln
- 5530 N Torrey Pines Dr
- 6409 Tina Ln
- 6401 Tina Ln
- 6424 Tina Ln
- 6417 Tina Ln
- 5521 Fiorinda Cir
- 5521 N Torrey Pines Dr
- 6404 Blacklion Ct
- 6401 W Ann Rd
- 5501 N Torrey Pines Dr
- 6408 Blacklion Ct
- 6409 W Ann Rd
- 6425 Tina Ln
- 6412 Blacklion Ct
- 6412 Blacklion Ct Unit n/a
- 5429 Tourmaline St