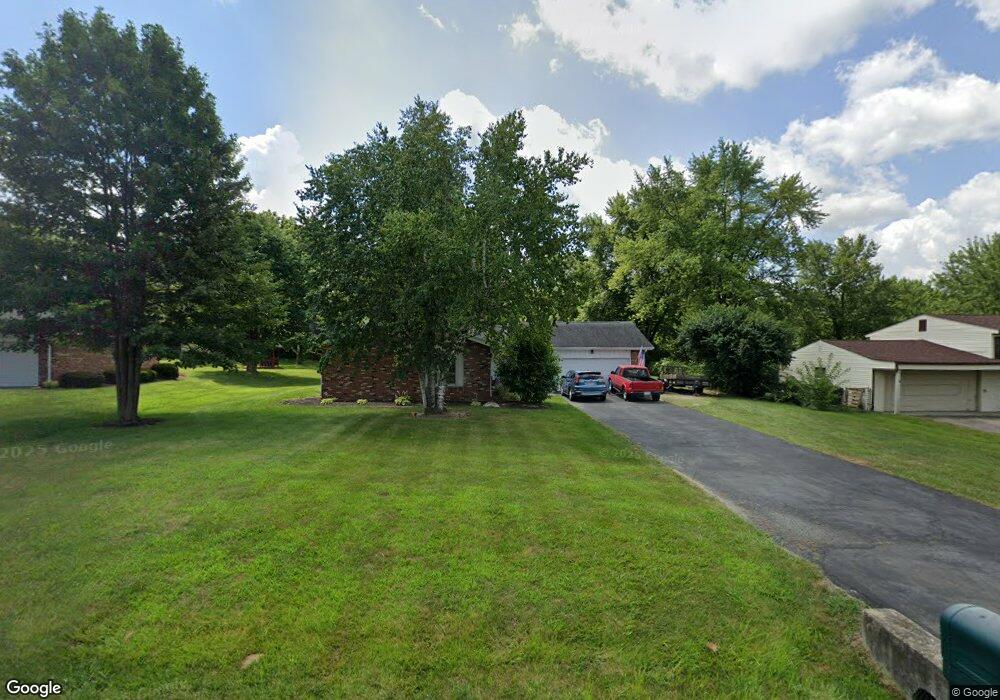
5511 E Decker Rd Franklin, OH 45005
Estimated Value: $206,000 - $265,000
3
Beds
2
Baths
1,360
Sq Ft
$171/Sq Ft
Est. Value
About This Home
This home is located at 5511 E Decker Rd, Franklin, OH 45005 and is currently estimated at $232,964, approximately $171 per square foot. 5511 E Decker Rd is a home located in Warren County with nearby schools including Franklin High School, Summit Academy Community School for Alternative Learners - Middletown, and St. John XXIII Catholic School.
Ownership History
Date
Name
Owned For
Owner Type
Purchase Details
Closed on
Jul 20, 2020
Sold by
Lewis Sylvia Ruth
Bought by
Leach Angela R and Leach Jared A
Current Estimated Value
Home Financials for this Owner
Home Financials are based on the most recent Mortgage that was taken out on this home.
Original Mortgage
$126,350
Outstanding Balance
$98,995
Interest Rate
3.1%
Mortgage Type
New Conventional
Estimated Equity
$133,969
Purchase Details
Closed on
Dec 27, 2011
Sold by
King Michael S and Estate Of June S Mullins
Bought by
Lewis James Franklin and Lewis Sylvia Ruth
Purchase Details
Closed on
Mar 30, 1994
Sold by
Mullins Aubrey and Mullins Virgini
Bought by
Mullins and Mullins Aubrey F
Purchase Details
Closed on
Jun 4, 1987
Sold by
Bishop Clara Y and Bishop Clara Y
Bought by
Mullins and Mullins Aubrey
Create a Home Valuation Report for This Property
The Home Valuation Report is an in-depth analysis detailing your home's value as well as a comparison with similar homes in the area
Home Values in the Area
Average Home Value in this Area
Purchase History
| Date | Buyer | Sale Price | Title Company |
|---|---|---|---|
| Leach Angela R | -- | First American Title | |
| Lewis James Franklin | $90,000 | Allstate Title Agency Llc | |
| Mullins | -- | -- | |
| Mullins | $65,000 | -- |
Source: Public Records
Mortgage History
| Date | Status | Borrower | Loan Amount |
|---|---|---|---|
| Open | Leach Angela R | $126,350 |
Source: Public Records
Tax History
| Year | Tax Paid | Tax Assessment Tax Assessment Total Assessment is a certain percentage of the fair market value that is determined by local assessors to be the total taxable value of land and additions on the property. | Land | Improvement |
|---|---|---|---|---|
| 2025 | $2,580 | $56,920 | $16,140 | $40,780 |
| 2024 | $2,580 | $56,920 | $16,140 | $40,780 |
| 2023 | $2,276 | $45,269 | $10,580 | $34,688 |
| 2022 | $2,220 | $45,269 | $10,581 | $34,689 |
| 2021 | $2,101 | $45,269 | $10,581 | $34,689 |
| 2020 | $2,066 | $38,364 | $8,967 | $29,397 |
| 2019 | $1,875 | $38,364 | $8,967 | $29,397 |
| 2018 | $1,816 | $38,364 | $8,967 | $29,397 |
| 2017 | $1,930 | $35,896 | $8,519 | $27,377 |
| 2016 | $1,974 | $35,896 | $8,519 | $27,377 |
| 2015 | $2,011 | $35,896 | $8,519 | $27,377 |
| 2014 | $1,964 | $35,900 | $8,520 | $27,380 |
| 2013 | $1,676 | $37,790 | $8,970 | $28,820 |
Source: Public Records
Map
Nearby Homes
- 25 Timber Creek Dr
- 65 Timber Creek Dr
- 5684 Olive Rd
- 5839 Shaker Rd
- 0 Kathy Ln Unit 954617
- 0 Kathy Ln Unit 1834240
- 7189 Shaker Rd
- 6510 Ohio 123
- 6510 State Route 123
- 218 Roberts Ave
- 1200 S River St
- 5744 Lynn St
- 5845 Manchester Rd
- 926 S Main St
- 25 Hudson St
- 853 S River St
- 1200 Riley Blvd
- 6644 Rivulet Dr
- 705 S Main St
- 6711 Hamilton Middletown Rd
- 5493 E Decker Rd
- 5529 E Decker Rd
- 5477 E Decker Rd
- 5547 E Decker Rd
- 5498 E Decker Rd
- 5565 E Decker Rd
- 5516 E Decker Rd
- 5490 E Decker Rd
- 5544 E Decker Rd
- 5445 E Decker Rd
- 5467 E Decker Rd
- 5562 E Decker Rd
- 5578 E Decker Rd
- 6456 Shaker Rd
- 5429 E Decker Rd
- 6436 Shaker Rd
- 6418 Shaker Rd
- 5411 E Decker Rd
- 6540 Shaker Rd
- 6362 Shaker Rd
Your Personal Tour Guide
Ask me questions while you tour the home.