55117 Maple Ave Bridgeport, OH 43912
Lansing NeighborhoodEstimated Value: $153,000 - $209,000
3
Beds
3
Baths
1,852
Sq Ft
$96/Sq Ft
Est. Value
About This Home
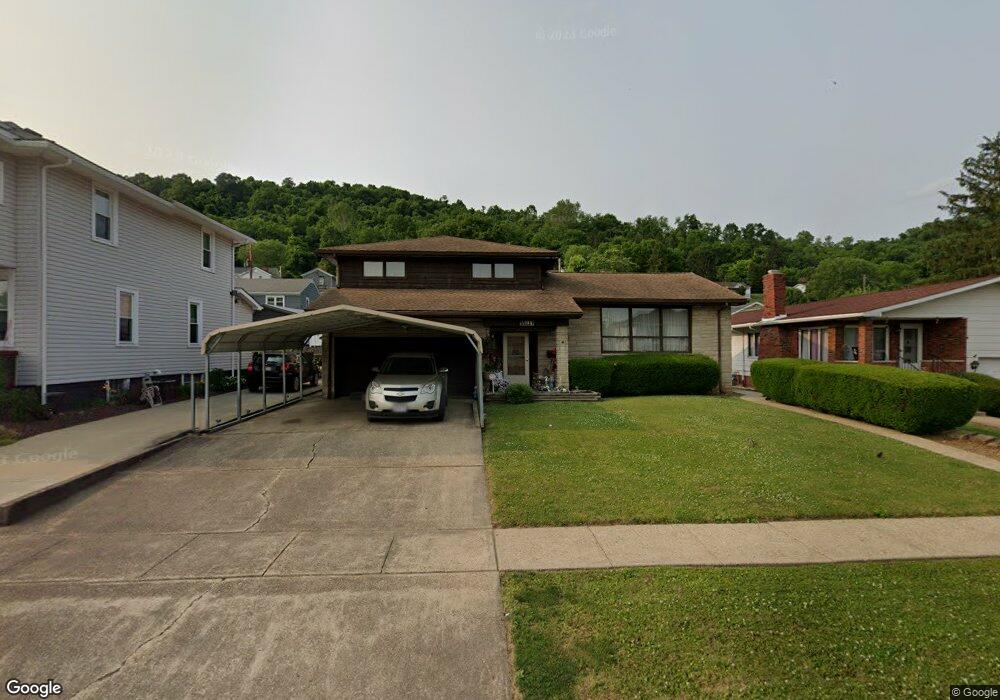
This home is located at 55117 Maple Ave, Bridgeport, OH 43912 and is currently estimated at $178,528, approximately $96 per square foot. 55117 Maple Ave is a home located in Belmont County with nearby schools including Bridgeport Elementary School, Bridgeport Middle School, and Bridgeport High School.
Ownership History
Date
Name
Owned For
Owner Type
Purchase Details
Closed on
Dec 6, 2018
Sold by
Walker Frederick A
Bought by
Krahel Christopher C and Krahel John R
Current Estimated Value
Purchase Details
Closed on
Sep 6, 2006
Sold by
Kroflich Richard P and Kroflich Kelly S
Bought by
Krahel Christopher C and Shriver Krahel Emily K
Home Financials for this Owner
Home Financials are based on the most recent Mortgage that was taken out on this home.
Original Mortgage
$105,000
Interest Rate
6.77%
Mortgage Type
Purchase Money Mortgage
Purchase Details
Closed on
Jan 1, 1986
Sold by
Kroflich Richard P and Kroflich Kell
Bought by
Kroflich Richard P and Kroflich Kell
Create a Home Valuation Report for This Property
The Home Valuation Report is an in-depth analysis detailing your home's value as well as a comparison with similar homes in the area
Home Values in the Area
Average Home Value in this Area
Purchase History
| Date | Buyer | Sale Price | Title Company |
|---|---|---|---|
| Krahel Christopher C | $55,000 | Showcase Title Agency | |
| Krahel Christopher C | $125,000 | None Available | |
| Kroflich Richard P | -- | -- |
Source: Public Records
Mortgage History
| Date | Status | Borrower | Loan Amount |
|---|---|---|---|
| Previous Owner | Krahel Christopher C | $105,000 |
Source: Public Records
Tax History Compared to Growth
Tax History
| Year | Tax Paid | Tax Assessment Tax Assessment Total Assessment is a certain percentage of the fair market value that is determined by local assessors to be the total taxable value of land and additions on the property. | Land | Improvement |
|---|---|---|---|---|
| 2024 | $2,456 | $61,410 | $2,940 | $58,470 |
| 2023 | $2,206 | $57,250 | $2,820 | $54,430 |
| 2022 | $2,205 | $57,249 | $2,821 | $54,428 |
| 2021 | $2,194 | $57,246 | $2,821 | $54,425 |
| 2020 | $1,956 | $47,700 | $2,350 | $45,350 |
| 2019 | $1,956 | $47,700 | $2,350 | $45,350 |
| 2018 | $2,165 | $47,700 | $2,350 | $45,350 |
| 2017 | $2,329 | $51,410 | $2,750 | $48,660 |
| 2016 | $2,332 | $51,410 | $2,750 | $48,660 |
| 2015 | $2,322 | $51,410 | $2,750 | $48,660 |
| 2014 | $1,885 | $42,390 | $2,500 | $39,890 |
| 2013 | $1,804 | $42,390 | $2,500 | $39,890 |
Source: Public Records
Map
Nearby Homes
- 55490 National Rd
- 55480 National Rd
- 55500 National Rd
- 69142 Woods Rd
- 56065 National Rd
- 69895 Woods Rd
- 56316 National Rd
- 26 Elm St
- 53679 Quimby Ave
- 56624 Boyd Ave
- 902 National Rd
- 70540 Colerain Rd
- 0 Blaine Chermont Rd
- 4 Walnut Ave
- 866 Main St
- 836 Main St
- 1123 Minellen Dr
- 69282 Zelda Ave
- 824 Howard St
- 56745 Ferryview Rd
- 55127 Maple Ave
- 55099 Maple Ave
- 55097 Maple Ave
- 55149 Maple Ave
- 55170 Poplar St
- 55190 Poplar Ave
- 55120 Maple Ave
- 55089 Maple Ave
- 55170 Poplar Ave
- 68620 Scott St
- 55160 Poplar Ave
- 55180 Poplar St
- 55122 Maple Ave
- 55110 Maple Ave
- 55150 Poplar Ave
- 68638 Scott St
- 55157 Maple St
- 55092 Maple Ave
- 68598 Scott St
- 55063 Maple Ave