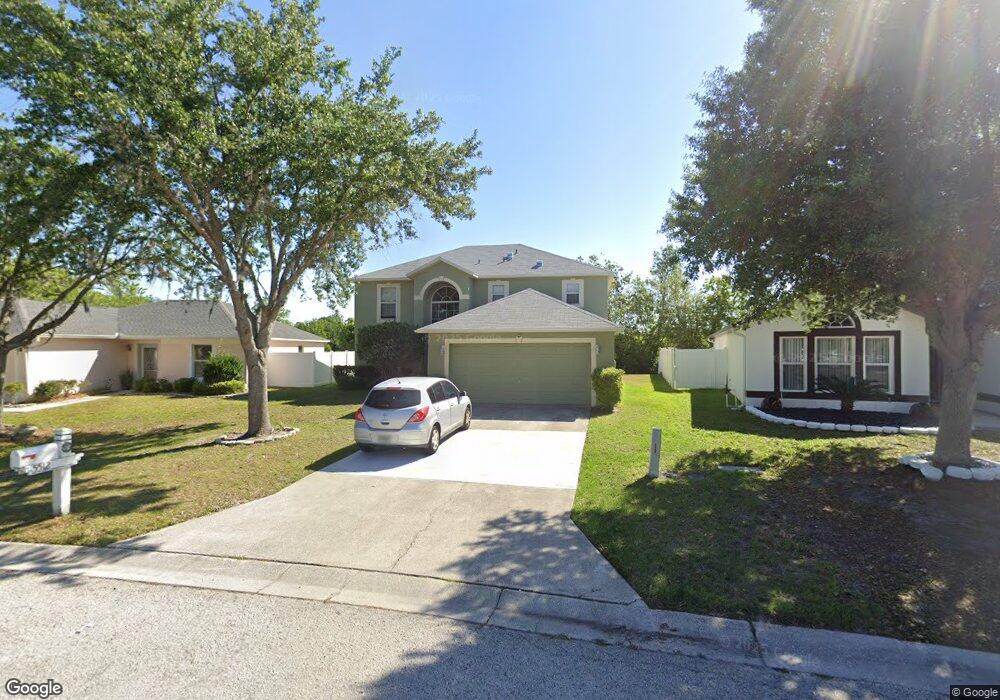
5512 Treig Ln Wesley Chapel, FL 33545
Estimated Value: $370,274 - $401,000
4
Beds
3
Baths
2,644
Sq Ft
$145/Sq Ft
Est. Value
About This Home
This home is located at 5512 Treig Ln, Wesley Chapel, FL 33545 and is currently estimated at $384,069, approximately $145 per square foot. 5512 Treig Ln is a home located in Pasco County with nearby schools including New River Elementary School, Thomas E. Weightman Middle School, and Wesley Chapel High School.
Ownership History
Date
Name
Owned For
Owner Type
Purchase Details
Closed on
Aug 1, 2017
Bought by
Tah 2017-1 Borrower Llc
Current Estimated Value
Purchase Details
Closed on
Aug 12, 2014
Sold by
Provident Residential Real Estate Fund L
Bought by
Sby 2014-1 Borrower Llc
Purchase Details
Closed on
Nov 23, 2010
Sold by
Vargas Marcela
Bought by
Provident Residential Real Estate Fund L
Purchase Details
Closed on
Oct 3, 2005
Sold by
Gray Shane A and Gray Jean Ann
Bought by
Vargas Marcela
Home Financials for this Owner
Home Financials are based on the most recent Mortgage that was taken out on this home.
Original Mortgage
$197,600
Interest Rate
7.15%
Mortgage Type
Purchase Money Mortgage
Purchase Details
Closed on
Sep 29, 2003
Sold by
Maronda Homes Inc Of Florida
Bought by
Gray Shane A
Home Financials for this Owner
Home Financials are based on the most recent Mortgage that was taken out on this home.
Original Mortgage
$145,195
Interest Rate
6.32%
Mortgage Type
FHA
Create a Home Valuation Report for This Property
The Home Valuation Report is an in-depth analysis detailing your home's value as well as a comparison with similar homes in the area
Home Values in the Area
Average Home Value in this Area
Purchase History
| Date | Buyer | Sale Price | Title Company |
|---|---|---|---|
| Tah 2017-1 Borrower Llc | $100 | -- | |
| Sby 2014-1 Borrower Llc | -- | None Available | |
| Provident Residential Real Estate Fund L | $96,800 | Attorney | |
| Vargas Marcela | $247,000 | Title Clearinghouse | |
| Gray Shane A | $147,475 | Adnoram Title Company |
Source: Public Records
Mortgage History
| Date | Status | Borrower | Loan Amount |
|---|---|---|---|
| Previous Owner | Vargas Marcela | $197,600 | |
| Previous Owner | Gray Shane A | $145,195 |
Source: Public Records
Tax History Compared to Growth
Tax History
| Year | Tax Paid | Tax Assessment Tax Assessment Total Assessment is a certain percentage of the fair market value that is determined by local assessors to be the total taxable value of land and additions on the property. | Land | Improvement |
|---|---|---|---|---|
| 2025 | $5,372 | $352,657 | $69,571 | $283,086 |
| 2024 | $5,372 | $337,668 | $66,391 | $271,277 |
| 2023 | $5,233 | $361,389 | $44,431 | $316,958 |
| 2022 | $4,110 | $275,569 | $37,111 | $238,458 |
| 2021 | $3,603 | $214,676 | $33,513 | $181,163 |
| 2020 | $3,346 | $198,783 | $33,513 | $165,270 |
| 2019 | $3,399 | $200,444 | $33,513 | $166,931 |
| 2018 | $3,256 | $191,229 | $33,513 | $157,716 |
| 2017 | $2,847 | $179,657 | $33,513 | $146,144 |
| 2016 | $2,540 | $154,421 | $24,965 | $129,456 |
| 2015 | $2,394 | $143,842 | $24,965 | $118,877 |
| 2014 | $2,203 | $138,842 | $24,965 | $113,877 |
Source: Public Records
Map
Nearby Homes
- 31704 Loch Aline Dr
- 5521 Brooklet Woods Dr
- 5513 Brooklet Woods Dr
- 31854 Asbury Ave
- Corina II Plan at Riverston at Chapel Crossings - Chapel Crossings
- Newport II Plan at Riverston at Chapel Crossings - Chapel Crossings
- Magnolia Plan at Riverston at Chapel Crossings - Chapel Crossings
- Coronado II Plan at Riverston at Chapel Crossings - Chapel Crossings
- Corina III Bonus Plan at Riverston at Chapel Crossings - Chapel Crossings
- Newport II Bonus Plan at Riverston at Chapel Crossings - Chapel Crossings
- Windsor Plan at Riverston at Chapel Crossings - Chapel Crossings
- Willow Plan at Riverston at Chapel Crossings - Chapel Crossings
- Aspen Plan at Riverston at Chapel Crossings - Chapel Crossings
- Santa Monica Plan at Riverston at Chapel Crossings - Chapel Crossings
- Sonoma II Plan at Riverston at Chapel Crossings - Chapel Crossings
- Cypress Plan at Riverston at Chapel Crossings - Chapel Crossings
- Santina II Plan at Riverston at Chapel Crossings - Chapel Crossings
- Palazzo Plan at Riverston at Chapel Crossings - Chapel Crossings
- Roxbury Plan at Riverston at Chapel Crossings - Chapel Crossings
- Corina III Plan at Riverston at Chapel Crossings - Chapel Crossings