5513 Ash Ave Raytown, MO 64133
Estimated Value: $122,000 - $148,000
3
Beds
1
Bath
800
Sq Ft
$176/Sq Ft
Est. Value
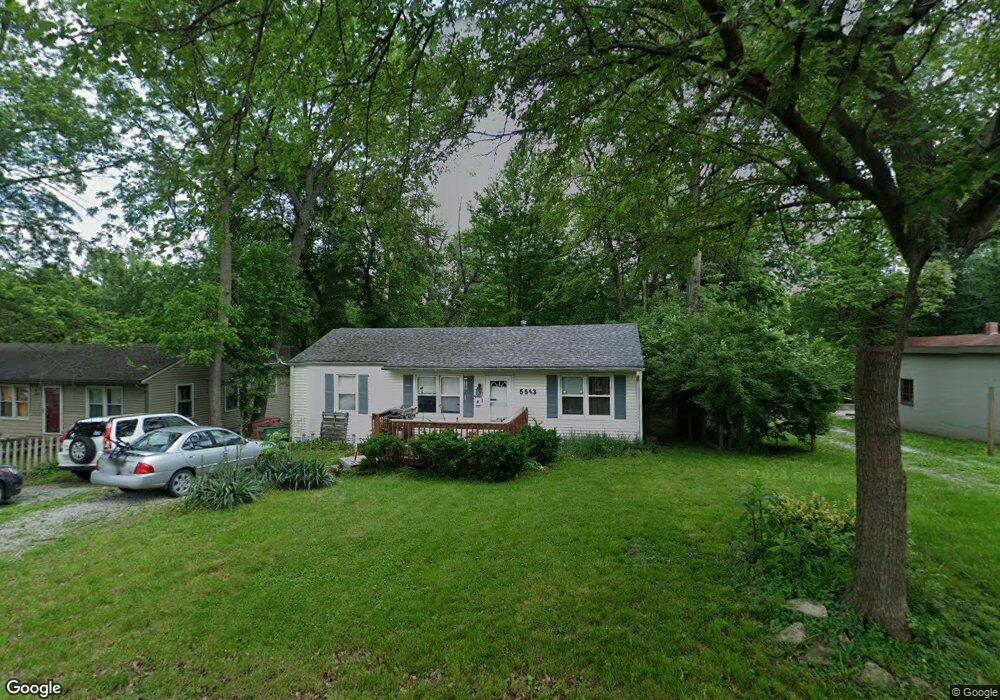
About This Home
This home is located at 5513 Ash Ave, Raytown, MO 64133 and is currently estimated at $141,016, approximately $176 per square foot. 5513 Ash Ave is a home located in Jackson County with nearby schools including Laurel Hills Elementary, Raytown Middle School, and Raytown South High School.
Ownership History
Date
Name
Owned For
Owner Type
Purchase Details
Closed on
Oct 5, 2015
Sold by
Alan F Jones Trust
Bought by
Ladonna J Miles Trust
Current Estimated Value
Purchase Details
Closed on
Sep 8, 2015
Sold by
Jones Alan F
Bought by
Miles La Donna J
Purchase Details
Closed on
Jan 15, 2008
Sold by
Jones Alan F and Miles Ladonna J
Bought by
Jones Alan F and Alan F Jones Trust
Purchase Details
Closed on
Aug 16, 2007
Sold by
Archer Tommy J and Archer Brenda K
Bought by
Jones Alan F and Miles Ladonna Jo
Home Financials for this Owner
Home Financials are based on the most recent Mortgage that was taken out on this home.
Original Mortgage
$44,000
Interest Rate
6.72%
Mortgage Type
New Conventional
Purchase Details
Closed on
Oct 31, 2003
Sold by
Holzbaur Russell R
Bought by
Archer Tommy J and Archer Brenda K
Home Financials for this Owner
Home Financials are based on the most recent Mortgage that was taken out on this home.
Original Mortgage
$50,400
Interest Rate
6.87%
Mortgage Type
Purchase Money Mortgage
Create a Home Valuation Report for This Property
The Home Valuation Report is an in-depth analysis detailing your home's value as well as a comparison with similar homes in the area
Home Values in the Area
Average Home Value in this Area
Purchase History
We collect this data history from publicly available records. To have your information removed, we recommend requesting removal directly through your county’s website.
| Date | Buyer | Sale Price | Title Company |
|---|---|---|---|
| Ladonna J Miles Trust | -- | None Available | |
| Miles La Donna J | -- | None Available | |
| Jones Alan F | -- | None Available | |
| Jones Alan F | -- | Coffelt Land Title Inc | |
| Archer Tommy J | -- | Stewart Title |
Source: Public Records
Mortgage History
We collect this data history from publicly available records. To have your information removed, we recommend requesting removal directly through your county’s website.
| Date | Status | Borrower | Loan Amount |
|---|---|---|---|
| Previous Owner | Jones Alan F | $44,000 | |
| Previous Owner | Archer Tommy J | $50,400 |
Source: Public Records
Tax History
| Year | Tax Paid | Tax Assessment Tax Assessment Total Assessment is a certain percentage of the fair market value that is determined by local assessors to be the total taxable value of land and additions on the property. | Land | Improvement |
|---|---|---|---|---|
| 2025 | $1,546 | $12,313 | $3,639 | $8,674 |
| 2024 | $1,536 | $17,142 | $3,730 | $13,412 |
| 2023 | $1,536 | $17,142 | $3,842 | $13,300 |
| 2022 | $876 | $9,310 | $3,202 | $6,108 |
| 2021 | $879 | $9,310 | $3,202 | $6,108 |
| 2020 | $976 | $10,245 | $3,202 | $7,043 |
| 2019 | $971 | $10,245 | $3,202 | $7,043 |
| 2018 | $906 | $9,896 | $2,219 | $7,677 |
| 2017 | $878 | $9,896 | $2,219 | $7,677 |
| 2016 | $878 | $9,648 | $2,348 | $7,300 |
| 2014 | $862 | $9,367 | $2,280 | $7,087 |
Source: Public Records
Map
Nearby Homes
- 5521 Ash Ave
- 10204 E 56th St
- 5433 Willow Ave
- 5516 Ralston Ave
- 5317 Ralston Ave
- 5425 Appleton Ave
- 5809 Ralston Ave
- Lot 6 Crownover Acres N A
- Lot 8 Crownover Acres N A
- 5110 Willow Ave
- 0 Raytown Rd Unit HMS2612059
- 5611 Harvard Ave
- 11108 E 57th St
- 5612 Crescent Ave
- 5220 Overton Ave
- 9532 E 58th St
- 9528 E 58th St
- 9524 E 58th St
- 9501 E 57th Terrace
- 10008 E 60th Terrace
Your Personal Tour Guide
Ask me questions while you tour the home.