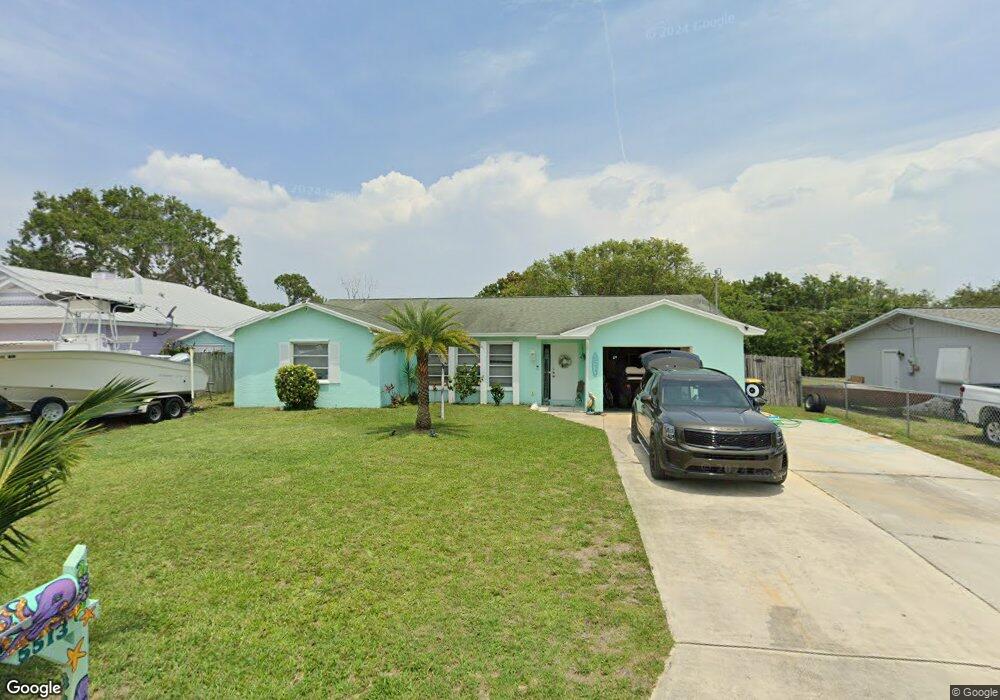
5513 SE Harbor Terrace Stuart, FL 34997
Estimated Value: $433,000 - $488,000
2
Beds
2
Baths
1,193
Sq Ft
$381/Sq Ft
Est. Value
About This Home
This home is located at 5513 SE Harbor Terrace, Stuart, FL 34997 and is currently estimated at $454,527, approximately $380 per square foot. 5513 SE Harbor Terrace is a home located in Martin County with nearby schools including Port Salerno Elementary School, Murray Middle School, and South Fork High School.
Ownership History
Date
Name
Owned For
Owner Type
Purchase Details
Closed on
Feb 22, 2022
Sold by
Ann Stuart Elizabeth and Ann Clifford H
Bought by
Capua William N and Stuart Jill
Current Estimated Value
Purchase Details
Closed on
Mar 20, 2014
Sold by
Pompano Terr Lot 21 Llc
Bought by
Self James W and Self Carla H
Purchase Details
Closed on
Jun 7, 2004
Sold by
Smith Jerald and Smith Cissy
Bought by
Pompano Terr Lot 21 Llc
Home Financials for this Owner
Home Financials are based on the most recent Mortgage that was taken out on this home.
Original Mortgage
$104,000
Interest Rate
6.25%
Mortgage Type
Purchase Money Mortgage
Purchase Details
Closed on
May 20, 1998
Sold by
Stuart Madrue P and Stuart Elizabeth A
Bought by
Stuart Elizabeth A and Stuart Clifford H
Purchase Details
Closed on
Dec 30, 1986
Bought by
Stuart Clifford H and Stuart Elizabeth A
Purchase Details
Closed on
Apr 1, 1985
Bought by
Stuart Clifford H and Stuart Elizabeth A
Create a Home Valuation Report for This Property
The Home Valuation Report is an in-depth analysis detailing your home's value as well as a comparison with similar homes in the area
Home Values in the Area
Average Home Value in this Area
Purchase History
| Date | Buyer | Sale Price | Title Company |
|---|---|---|---|
| Capua William N | $1,925 | Prestige Title | |
| Self James W | $74,000 | Attorney | |
| Pompano Terr Lot 21 Llc | $130,000 | -- | |
| Stuart Elizabeth A | $100 | -- | |
| Stuart Clifford H | $100 | -- | |
| Stuart Clifford H | $23,000 | -- |
Source: Public Records
Mortgage History
| Date | Status | Borrower | Loan Amount |
|---|---|---|---|
| Previous Owner | Pompano Terr Lot 21 Llc | $104,000 |
Source: Public Records
Tax History Compared to Growth
Tax History
| Year | Tax Paid | Tax Assessment Tax Assessment Total Assessment is a certain percentage of the fair market value that is determined by local assessors to be the total taxable value of land and additions on the property. | Land | Improvement |
|---|---|---|---|---|
| 2025 | $4,310 | $284,765 | -- | -- |
| 2024 | $4,216 | $276,740 | -- | -- |
| 2023 | $4,216 | $268,680 | $0 | $0 |
| 2022 | $5,782 | $296,186 | $0 | $0 |
| 2021 | $5,049 | $269,260 | $190,000 | $79,260 |
| 2020 | $1,402 | $249,350 | $175,000 | $74,350 |
| 2019 | $4,441 | $239,230 | $170,000 | $69,230 |
| 2018 | $3,830 | $231,550 | $165,000 | $66,550 |
| 2017 | $3,460 | $228,130 | $175,000 | $53,130 |
| 2016 | $3,645 | $229,590 | $175,000 | $54,590 |
| 2015 | -- | $189,990 | $135,000 | $54,990 |
| 2014 | -- | $174,880 | $115,000 | $59,880 |
Source: Public Records
Map
Nearby Homes
- 3673 SE Forecastle Ct
- 5216 SE Orange St
- 5270 SE Seascape Way Unit 102
- 5200 SE Seascape Way Unit 201
- 5548 SE Schooner Oaks Way
- 5184 SE Schooner Oaks Way Unit D
- 5336 SE Schooner Oaks Way
- 5145 SE Matousek St
- 4360 SE Kubin Ave
- 5095 SE Manatee Terrace
- 4200 SE Peterson Ln
- 5273 SE Tall Pines Way
- 4882 SE Bayshore Terrace
- 5413 SE Miles Grant Rd Unit 205
- 5413 SE Miles Grant Rd Unit 206
- 5413 SE Miles Grant Rd Unit 104
- 5423 SE Miles Grant Rd Unit F201
- 5403 SE Miles Grant Rd Unit 209
- 5433 SE Miles Grant Rd Unit E104
- 5403 SE Miles Grant Rd Unit H-111
- 5493 SE Harbor Terrace
- 5494 SE Harbor Terrace
- 5463 SE Harbor Terrace
- 5483 SE Harbor Terrace
- 5484 SE Harbor Terrace
- 5514 SE Harbor Terrace
- 5454 SE Harbor Terrace
- 5464 SE Harbor Terrace
- 5453 SE Harbor Terrace
- 5534 SE Harbor Terrace
- 5574 SE Harbor Terrace
- 5444 SE Harbor Terrace
- 5533 SE Harbor Terrace
- 5373 SE Inlet Place
- 5443 SE Harbor Terrace
- 5424 SE Harbor Terrace
- 5543 SE Harbor Terrace
- 5423 SE Harbor Terrace
- 5393 SE Inlet Place
- 5412 SE Inlet Place