Estimated Value: $489,782 - $532,000
6
Beds
3
Baths
2,314
Sq Ft
$220/Sq Ft
Est. Value
About This Home
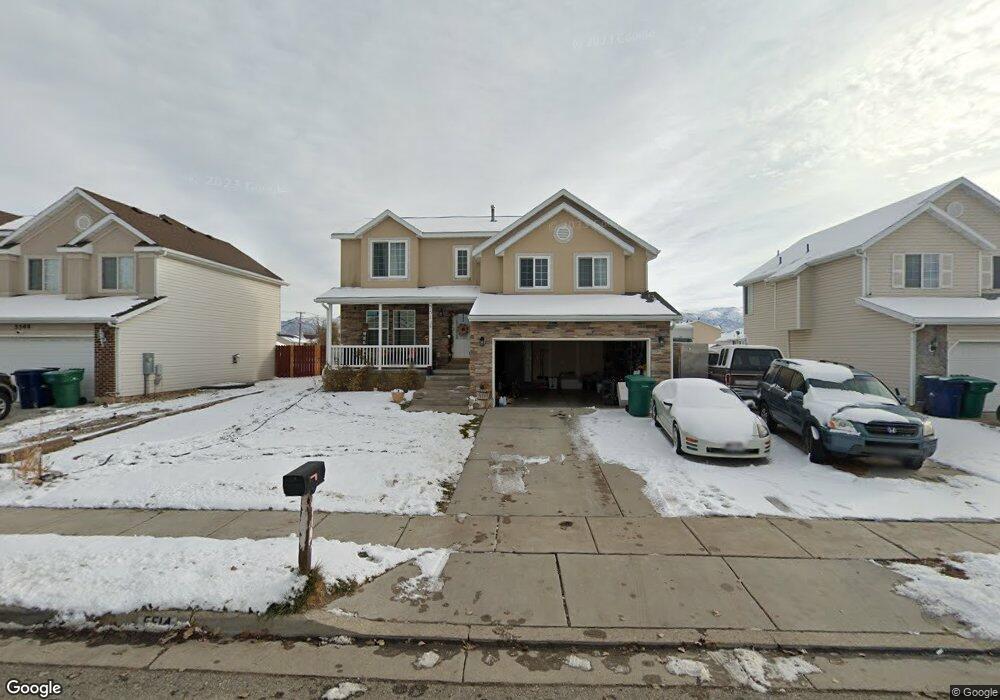
This home is located at 5514 S 4100 W, Roy, UT 84067 and is currently estimated at $507,946, approximately $219 per square foot. 5514 S 4100 W is a home located in Weber County with nearby schools including Freedom School, Roy Junior High School, and Roy High School.
Ownership History
Date
Name
Owned For
Owner Type
Purchase Details
Closed on
Oct 5, 2004
Sold by
Thompson Perry A and Thompson Ila Mae
Bought by
Thompson Gary D and Thompson Susanne
Current Estimated Value
Purchase Details
Closed on
Oct 7, 1999
Sold by
Gmw Development Inc
Bought by
Nakasone Thian A Y and Nakasone Shelley
Home Financials for this Owner
Home Financials are based on the most recent Mortgage that was taken out on this home.
Original Mortgage
$146,000
Outstanding Balance
$43,848
Interest Rate
7.76%
Estimated Equity
$464,098
Create a Home Valuation Report for This Property
The Home Valuation Report is an in-depth analysis detailing your home's value as well as a comparison with similar homes in the area
Home Values in the Area
Average Home Value in this Area
Purchase History
| Date | Buyer | Sale Price | Title Company |
|---|---|---|---|
| Thompson Gary D | -- | -- | |
| Nakasone Thian A Y | -- | Bonneville Title Company |
Source: Public Records
Mortgage History
| Date | Status | Borrower | Loan Amount |
|---|---|---|---|
| Open | Nakasone Thian A Y | $146,000 |
Source: Public Records
Tax History
| Year | Tax Paid | Tax Assessment Tax Assessment Total Assessment is a certain percentage of the fair market value that is determined by local assessors to be the total taxable value of land and additions on the property. | Land | Improvement |
|---|---|---|---|---|
| 2025 | $3,013 | $484,779 | $130,672 | $354,107 |
| 2024 | $2,910 | $259,049 | $71,877 | $187,172 |
| 2023 | $2,768 | $246,400 | $64,216 | $182,184 |
| 2022 | $3,063 | $282,700 | $59,060 | $223,640 |
| 2021 | $2,337 | $352,000 | $78,203 | $273,797 |
| 2020 | $2,007 | $275,000 | $78,203 | $196,797 |
| 2019 | $2,044 | $265,000 | $43,547 | $221,453 |
| 2018 | $1,914 | $233,000 | $38,427 | $194,573 |
| 2017 | $1,847 | $211,000 | $38,427 | $172,573 |
| 2016 | $1,741 | $106,661 | $20,830 | $85,831 |
| 2015 | $1,530 | $95,192 | $20,830 | $74,362 |
| 2014 | $1,495 | $91,764 | $17,951 | $73,813 |
Source: Public Records
Map
Nearby Homes
- 5520 S 4100 W
- 5508 S 4100 W
- 5540 S 4100 W
- 4080 W 5550 S
- 4107 W 5500 S
- 5513 S 4100 W
- 5523 S 4100 W
- 4072 W 5550 S
- 4143 W 5500 S
- 5484 S 4100 W
- 5537 S 4100 W
- 4100 W 5500 S
- 5554 S 4100 W
- 5483 S 4075 W
- 5549 S 4100 W Unit 6
- 5468 S 4100 W
- 5468 S 4100 W
- 5468 S 4100 W Unit 57
- 5483 S 4100 W
- 5483 S 4100 W Unit 59
Your Personal Tour Guide
Ask me questions while you tour the home.