5515 Dunbar Dr Oxnard, CA 93033
Cypress NeighborhoodEstimated Value: $872,000 - $1,050,000
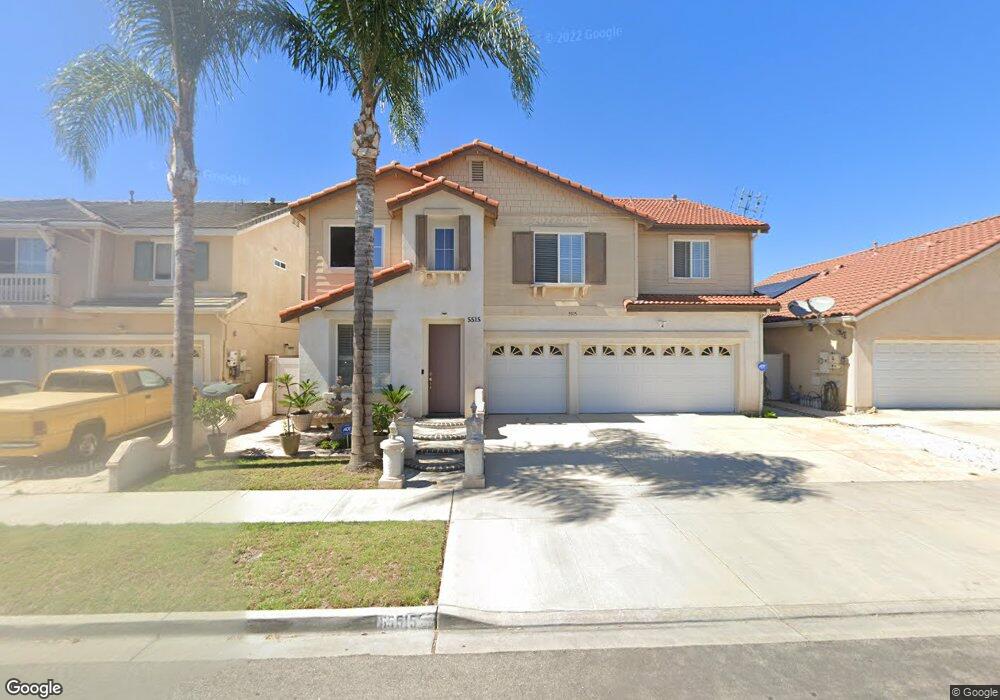
About This Home
This home is located at 5515 Dunbar Dr, Oxnard, CA 93033 and is currently estimated at $962,546, approximately $345 per square foot. 5515 Dunbar Dr is a home located in Ventura County with nearby schools including Channel Islands High School.
Ownership History
We collect this data history from publicly available records. To have your information removed, we recommend requesting removal directly through your county’s website.
Purchase Details
Home Financials for this Owner
Home Financials are based on the most recent Mortgage that was taken out on this home.Home Values in the Area
Average Home Value in this Area
Purchase History
We collect this data history from publicly available records. To have your information removed, we recommend requesting removal directly through your county’s website.
| Date | Buyer | Sale Price | Title Company |
|---|---|---|---|
| $419,500 | First American Title Ins Co |
Mortgage History
We collect this data history from publicly available records. To have your information removed, we recommend requesting removal directly through your county’s website.
| Date | Status | Borrower | Loan Amount |
|---|---|---|---|
| Closed | $171,308 | ||
| Closed | $150,000 | ||
| Closed | $300,000 | ||
| Closed | $250,000 |
Tax History
We collect this data history from publicly available records. To have your information removed, we recommend requesting removal directly through your county’s website.
| Year | Tax Paid | Tax Assessment Tax Assessment Total Assessment is a certain percentage of the fair market value that is determined by local assessors to be the total taxable value of land and additions on the property. | Land | Improvement |
|---|---|---|---|---|
| 2025 | $6,958 | $611,451 | $242,841 | $368,610 |
| 2024 | $6,958 | $599,462 | $238,079 | $361,383 |
| 2023 | $6,952 | $587,708 | $233,410 | $354,298 |
| 2022 | $6,587 | $576,185 | $228,834 | $347,351 |
| 2021 | $6,805 | $564,888 | $224,347 | $340,541 |
| 2020 | $7,087 | $559,098 | $222,048 | $337,050 |
| 2019 | $6,619 | $548,137 | $217,695 | $330,442 |
| 2018 | $6,500 | $537,390 | $213,427 | $323,963 |
| 2017 | $6,336 | $526,854 | $209,243 | $317,611 |
| 2016 | $6,206 | $516,525 | $205,141 | $311,384 |
| 2015 | $6,341 | $501,000 | $200,000 | $301,000 |
| 2014 | $5,767 | $453,000 | $181,000 | $272,000 |
Map
- 525 Dylan Dr Unit 58
- 341 Cuesta Del Mar Dr
- 540 Cuesta Del Mar Dr
- 5215 Jefferson Square
- 5154 Jefferson Square Unit 24
- 5117 Jefferson Square
- 5222 Longfellow Way
- 5340 S J St
- 163 E Dollie St
- 4720 Cloyne St
- 4632 S C St
- 117 Ann Ave
- 330 Harbor Breeze Dr
- 187 Seabluff Dr
- 197 Pelican Pointe Ct
- 922 Lighthouse Way
- 948 Lighthouse Way
- 840 Bluewater Way
- 767 Reef Cir
- 719 E Pleasant Valley Rd
Ask me questions while you tour the home.